

Meta Ad Analytics
ContentStudio's Meta Ads Analytics gives you a complete view of your Meta ad performance across every level of your account — from overall spend and conversions down to individual creatives and audience demographics. You can track how your campaigns are trending, compare performance across ad sets and ads, and get AI-generated recommendations on where to shift budget and what to fix first, all without leaving ContentStudio.
In this Article
The Meta Ads section in ContentStudio Analytics gives you a centralised view of your paid advertising performance across Facebook, Instagram, Messenger, Threads, and Audience Network — all in one place, without needing to log into Ads Manager.
Every metric is pulled directly from your connected Meta Ads account and updated on demand. You can track spend, reach, impressions, clicks, and conversions — and drill from account level down to individual ad creatives.
The analytics are split into seven tabs: Overview, Performance, Campaigns, Ad Sets, Ads, Demographics, and AI Insights. Each tab goes deeper into a different layer of your account.
Connect the Meta Ads account
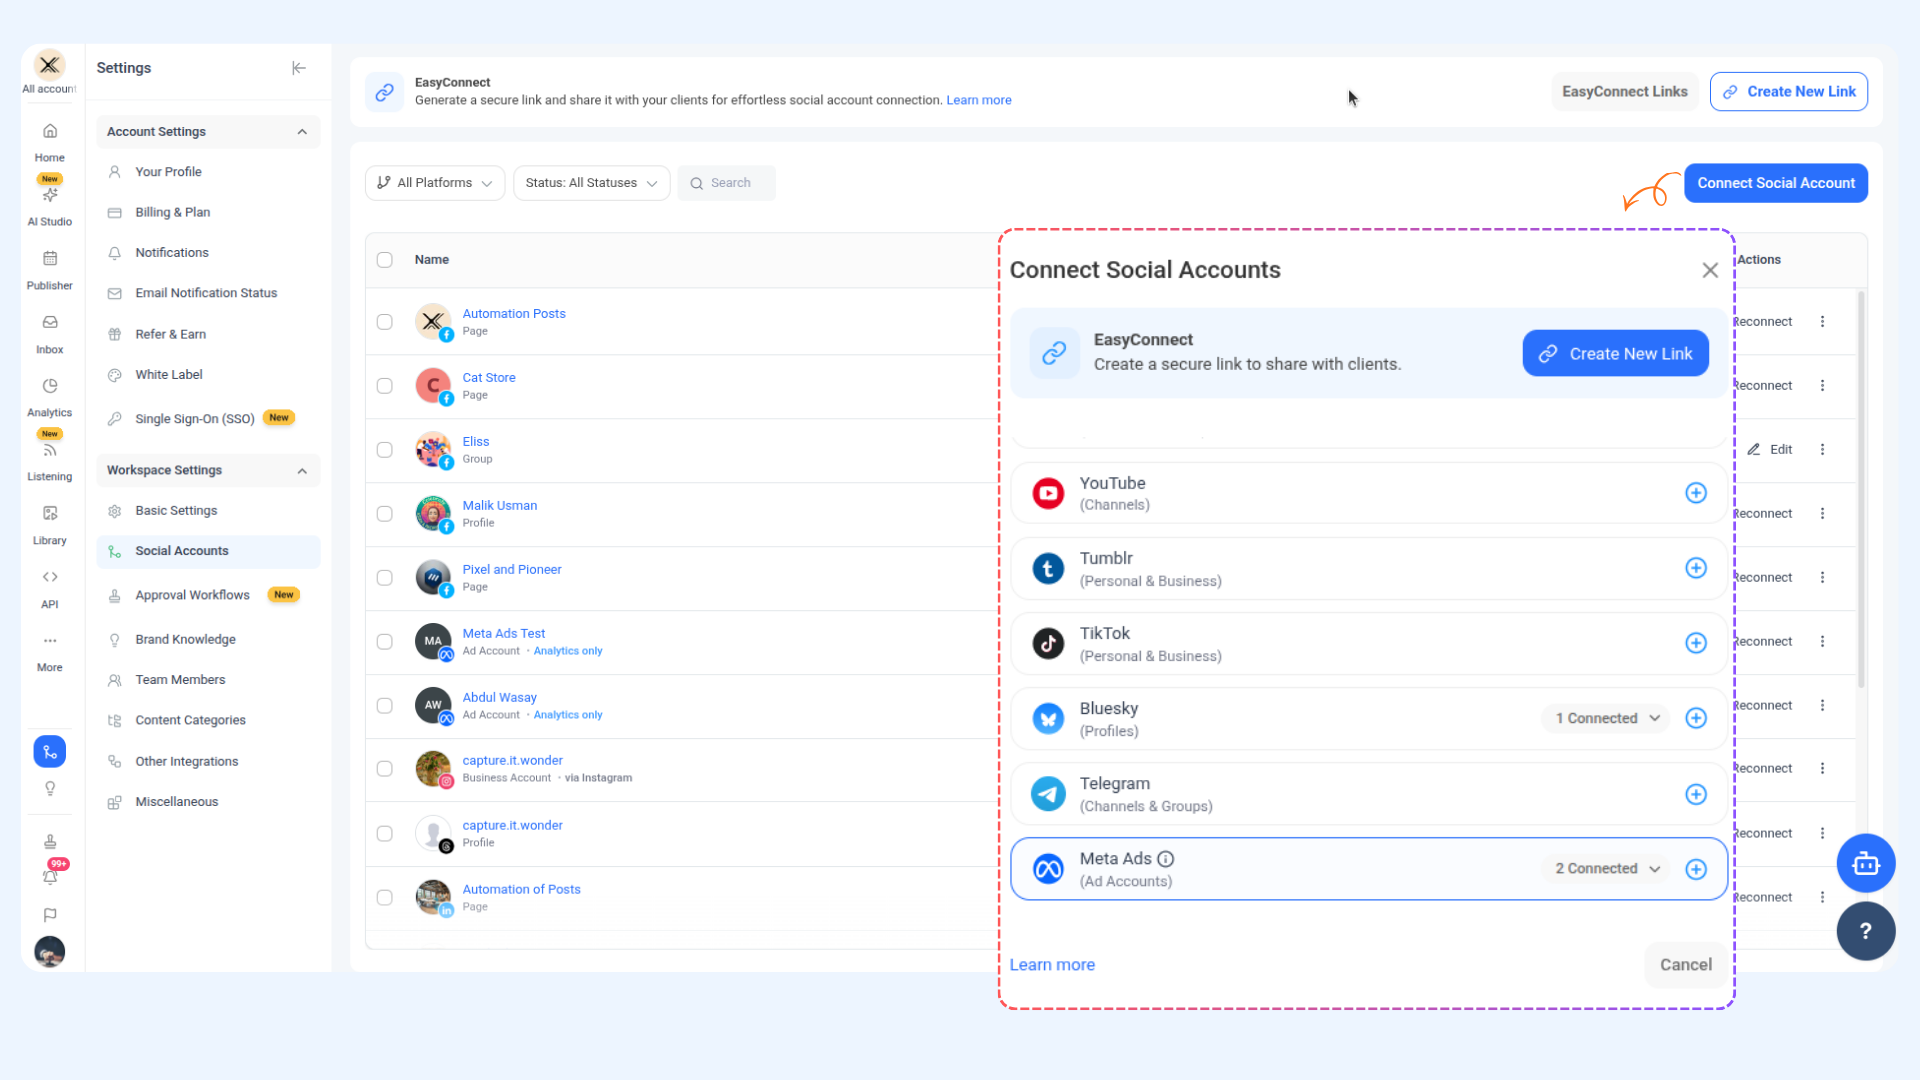
Click your profile icon in the bottom left corner of ContentStudio, then select Social Accounts from the Workspace Settings section.
Click Connect Social Account in the top right, scroll down to Meta Ads (Ad Accounts), and click Connect.
Access Meta Ad Analytics
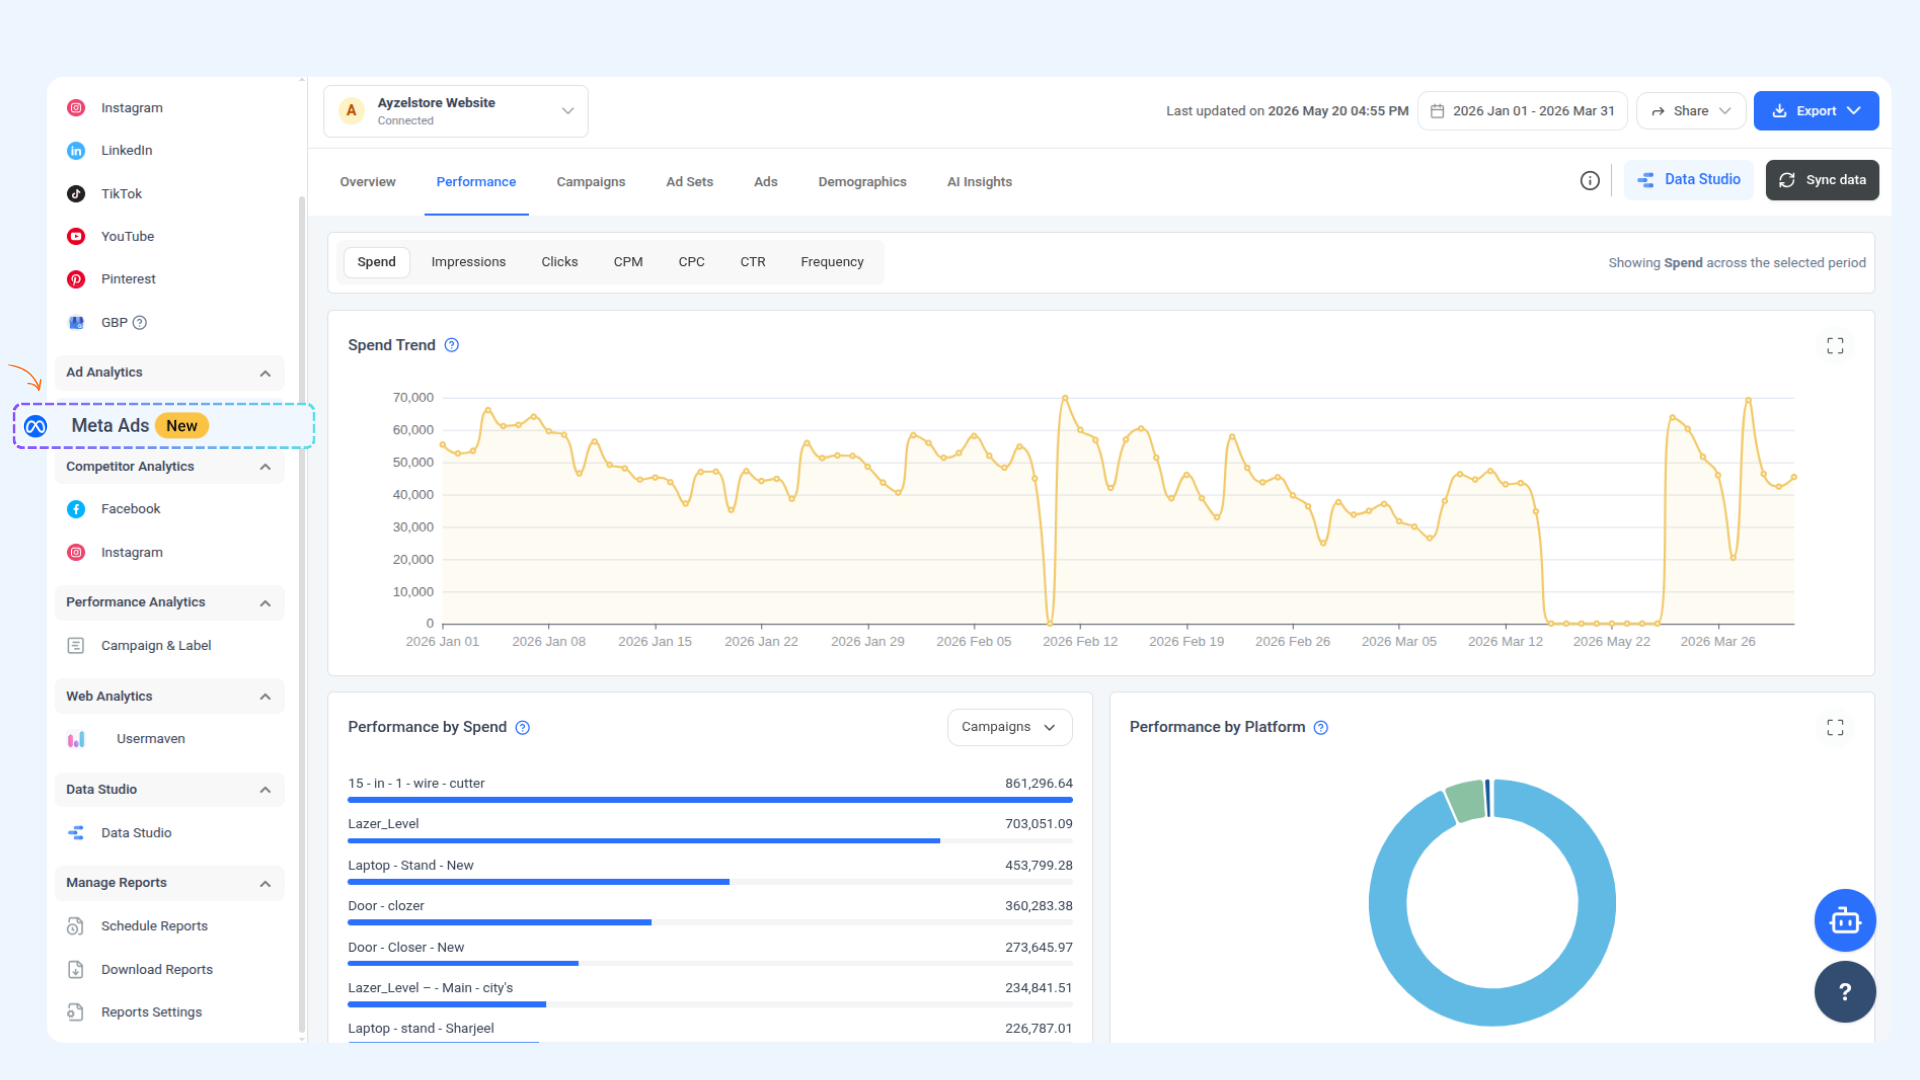
Go to Analytics → Ad Analytics → Meta Ads from the left sidebar in ContentStudio.
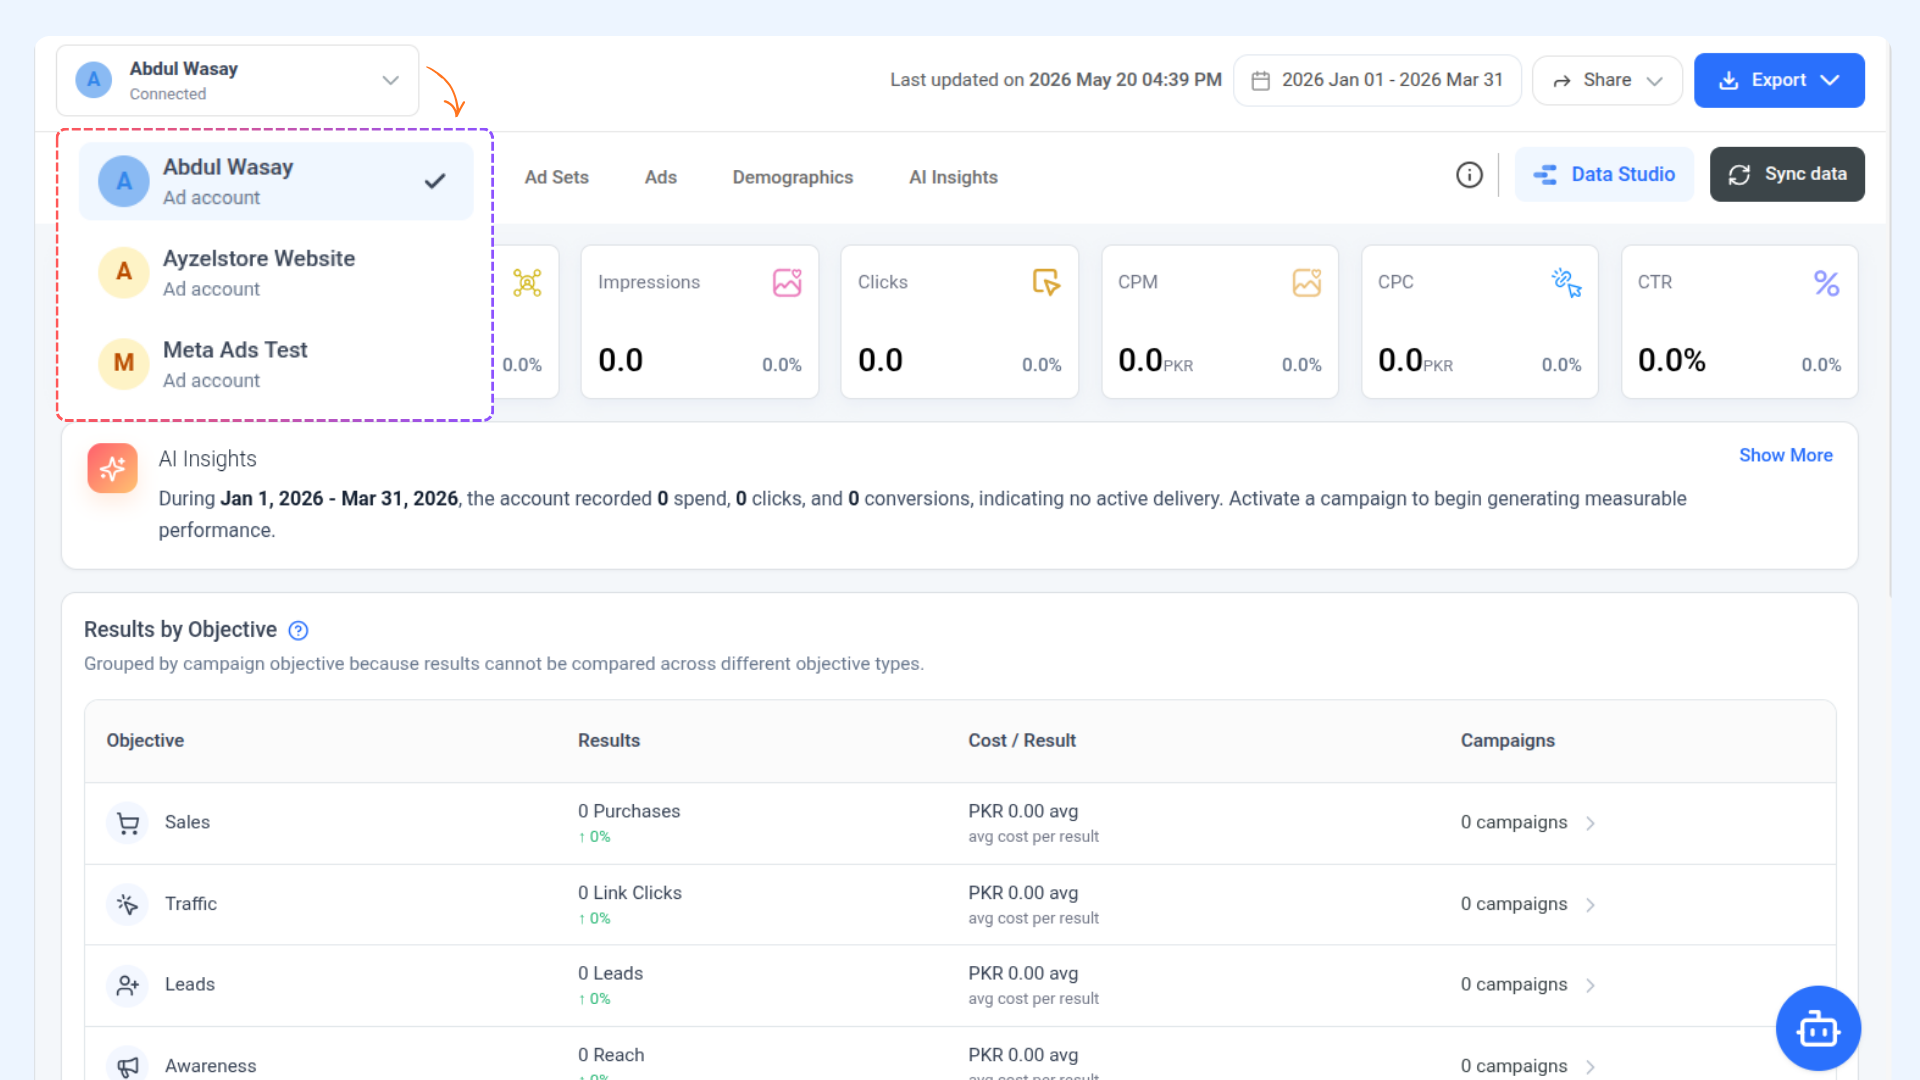
Use the account selector at the top left to choose which connected Meta Ads account you want to view. You can switch between accounts at any time.
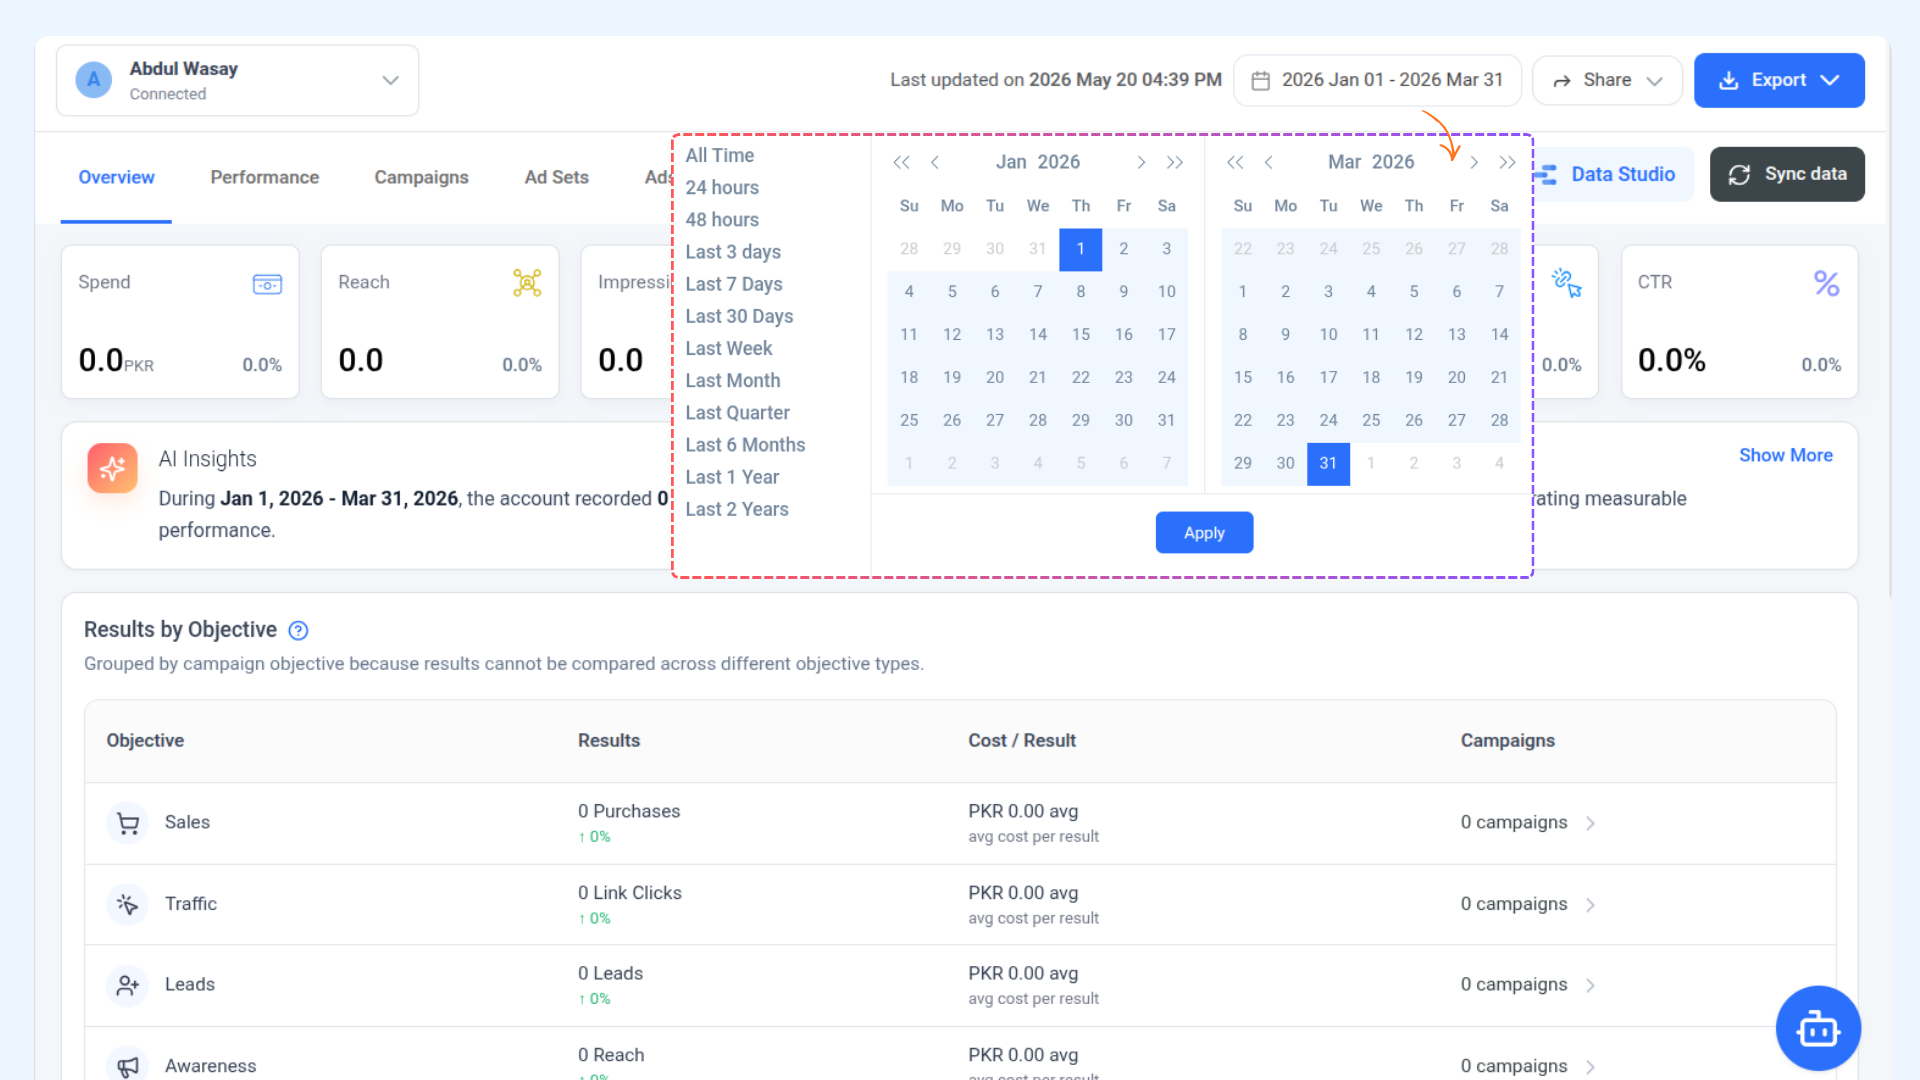
Use the date picker in the top right to set your reporting period. All seven tabs update to reflect the selected range.
Click Sync data in the top right corner to pull the latest data from Meta. The timestamp next to the button shows when the data was last updated.
The Overview
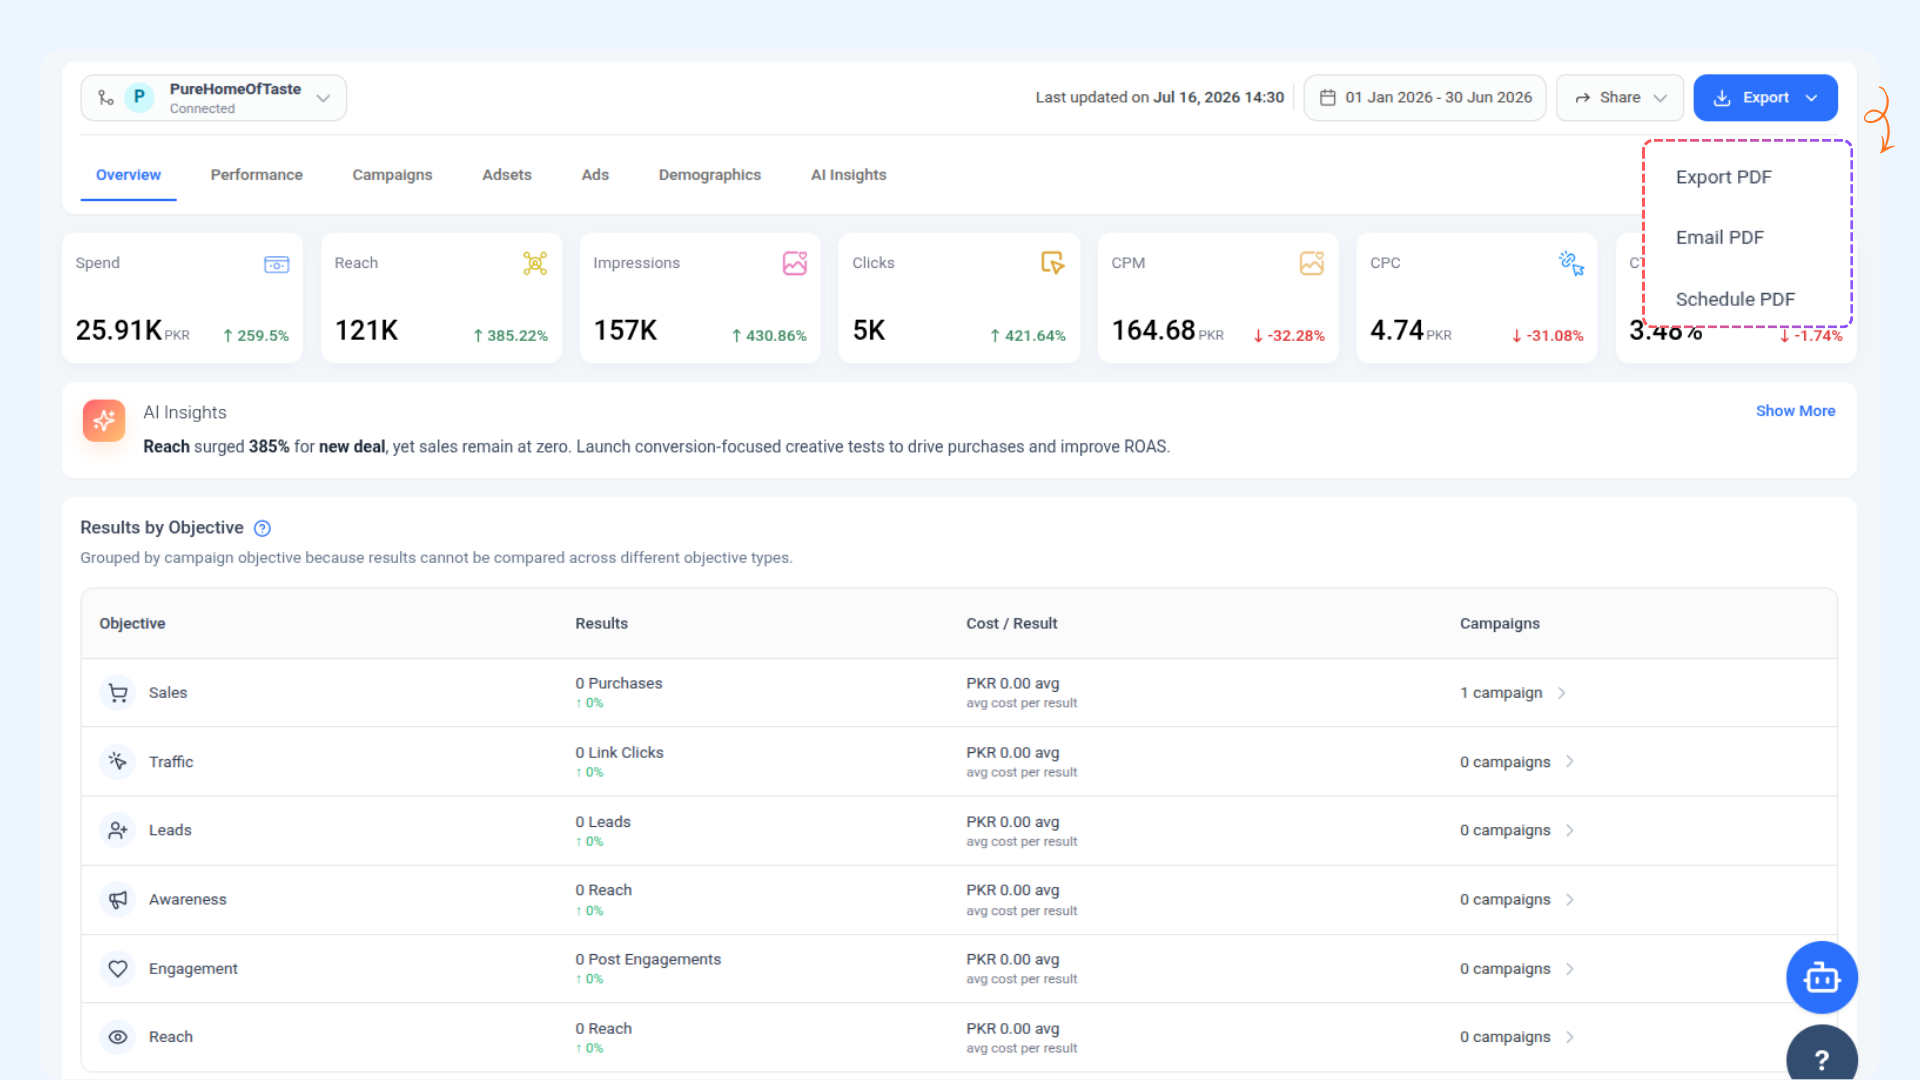
The Overview tab opens with seven metric tiles across the top of the page. Each tile shows the value for your selected period and a percentage change versus the previous period of equal length directly below it.
A red downward arrow means the metric declined compared to the previous period. A green upward arrow means it improved. Not all declines are bad — context matters. A rising CPM alongside a falling CTR, for example, signals you are paying more to reach people who are less likely to click.
Metric | What It Measures | What to Watch For |
|---|---|---|
Spend | Total amount spent on ads in the selected period | Large drops may mean paused campaigns or budget exhaustion; large spikes may indicate runaway spend |
Reach | Number of unique accounts that saw at least one of your ads | Declining reach with stable spend means your CPM is rising |
Impressions | Total number of times your ads were displayed, including multiple views by the same person | Impressions can grow while reach falls if frequency is rising |
Clicks | Total number of clicks across all ads in the period | Includes link clicks, button clicks, and other interactions depending on campaign objective |
CPM | Cost per 1,000 impressions | Rising CPM means the auction is getting more expensive — due to competition, audience size, or ad quality score |
CPC | Average cost per click | Rising CPC alongside falling CTR is a strong sign of creative fatigue or poor audience targeting |
CTR | Percentage of impressions that resulted in a click | For e-commerce Sales campaigns, 1–3% is a typical benchmark. Sustained decline usually points to ad fatigue |
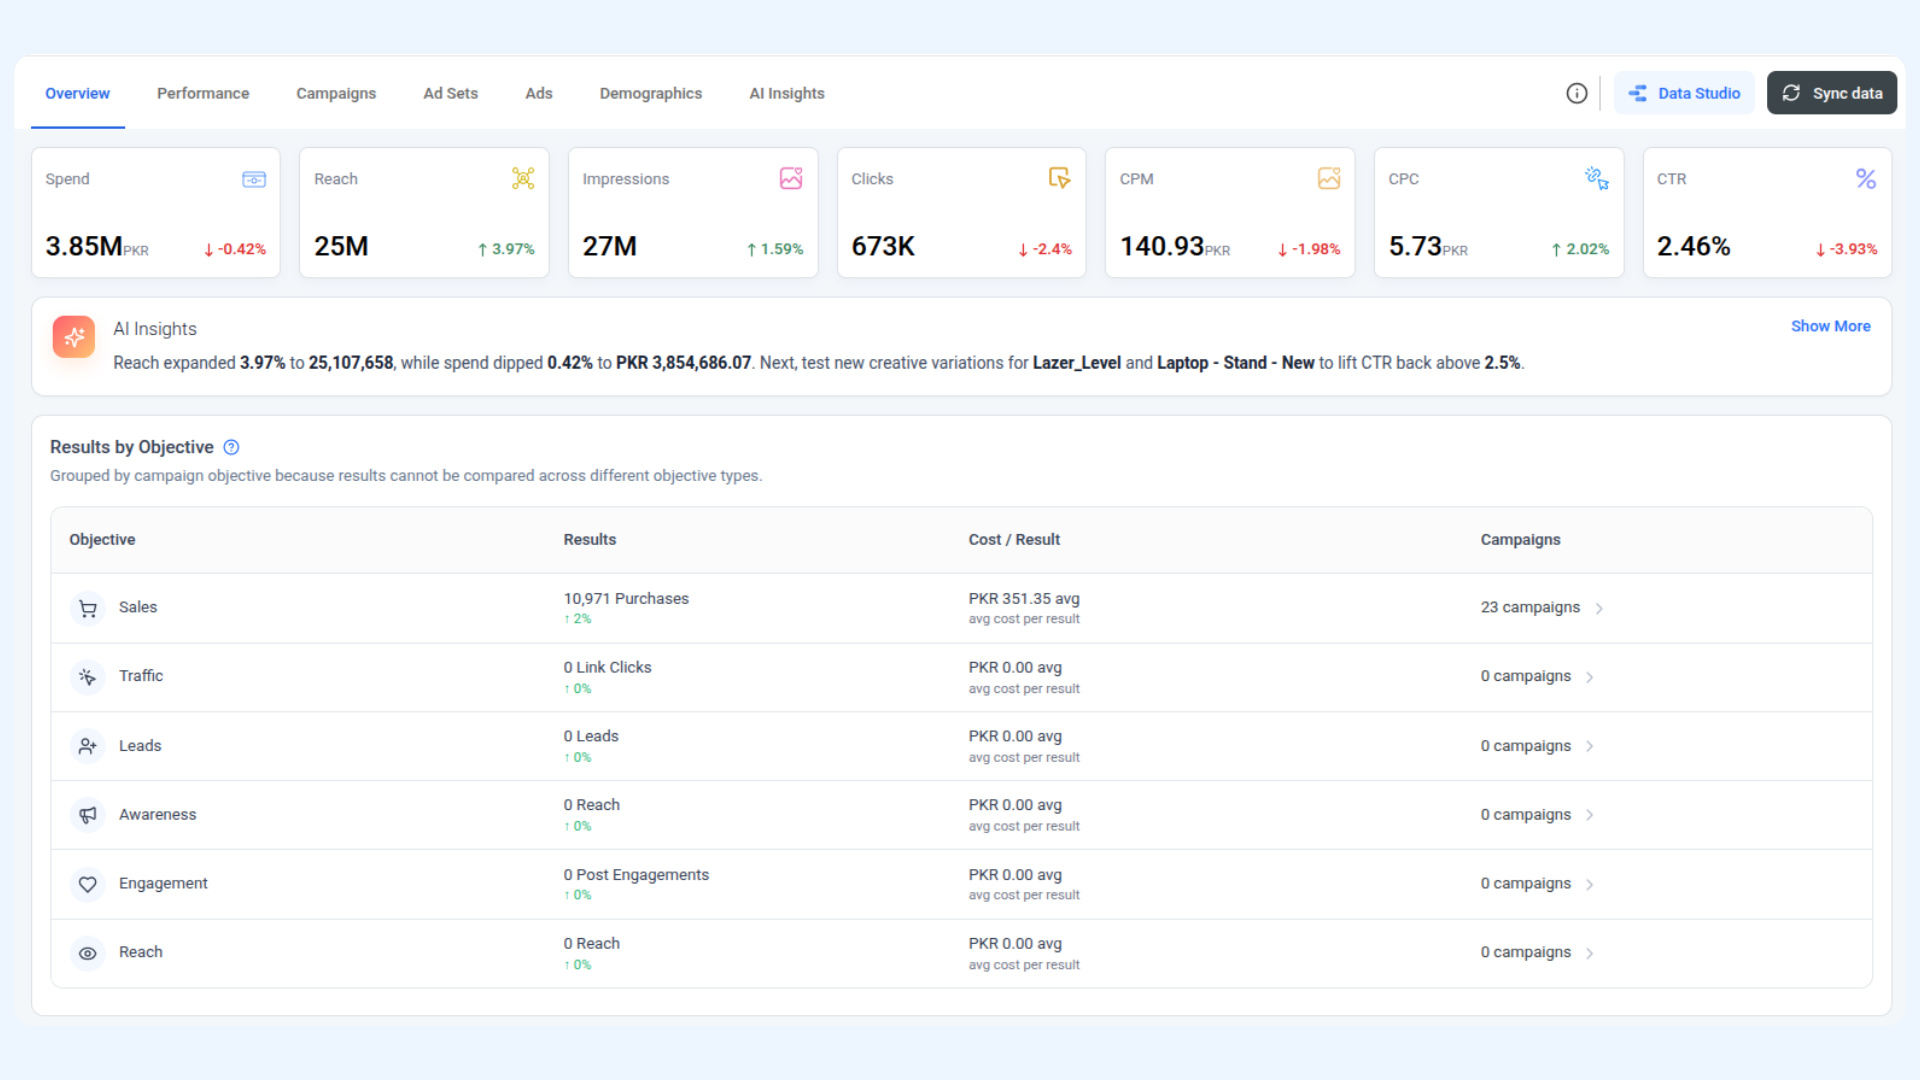
Overview — AI Insights Banner
Below the metric tiles, a condensed AI-generated insight flags the single most significant change in your account for the selected period, and suggests one immediate action to take.
Click Show More on the right side of the banner to open the full AI Insights tab, which contains a complete account analysis, a prioritised action plan, and a 7-day optimisation checklist.
Overview — Results by Objective
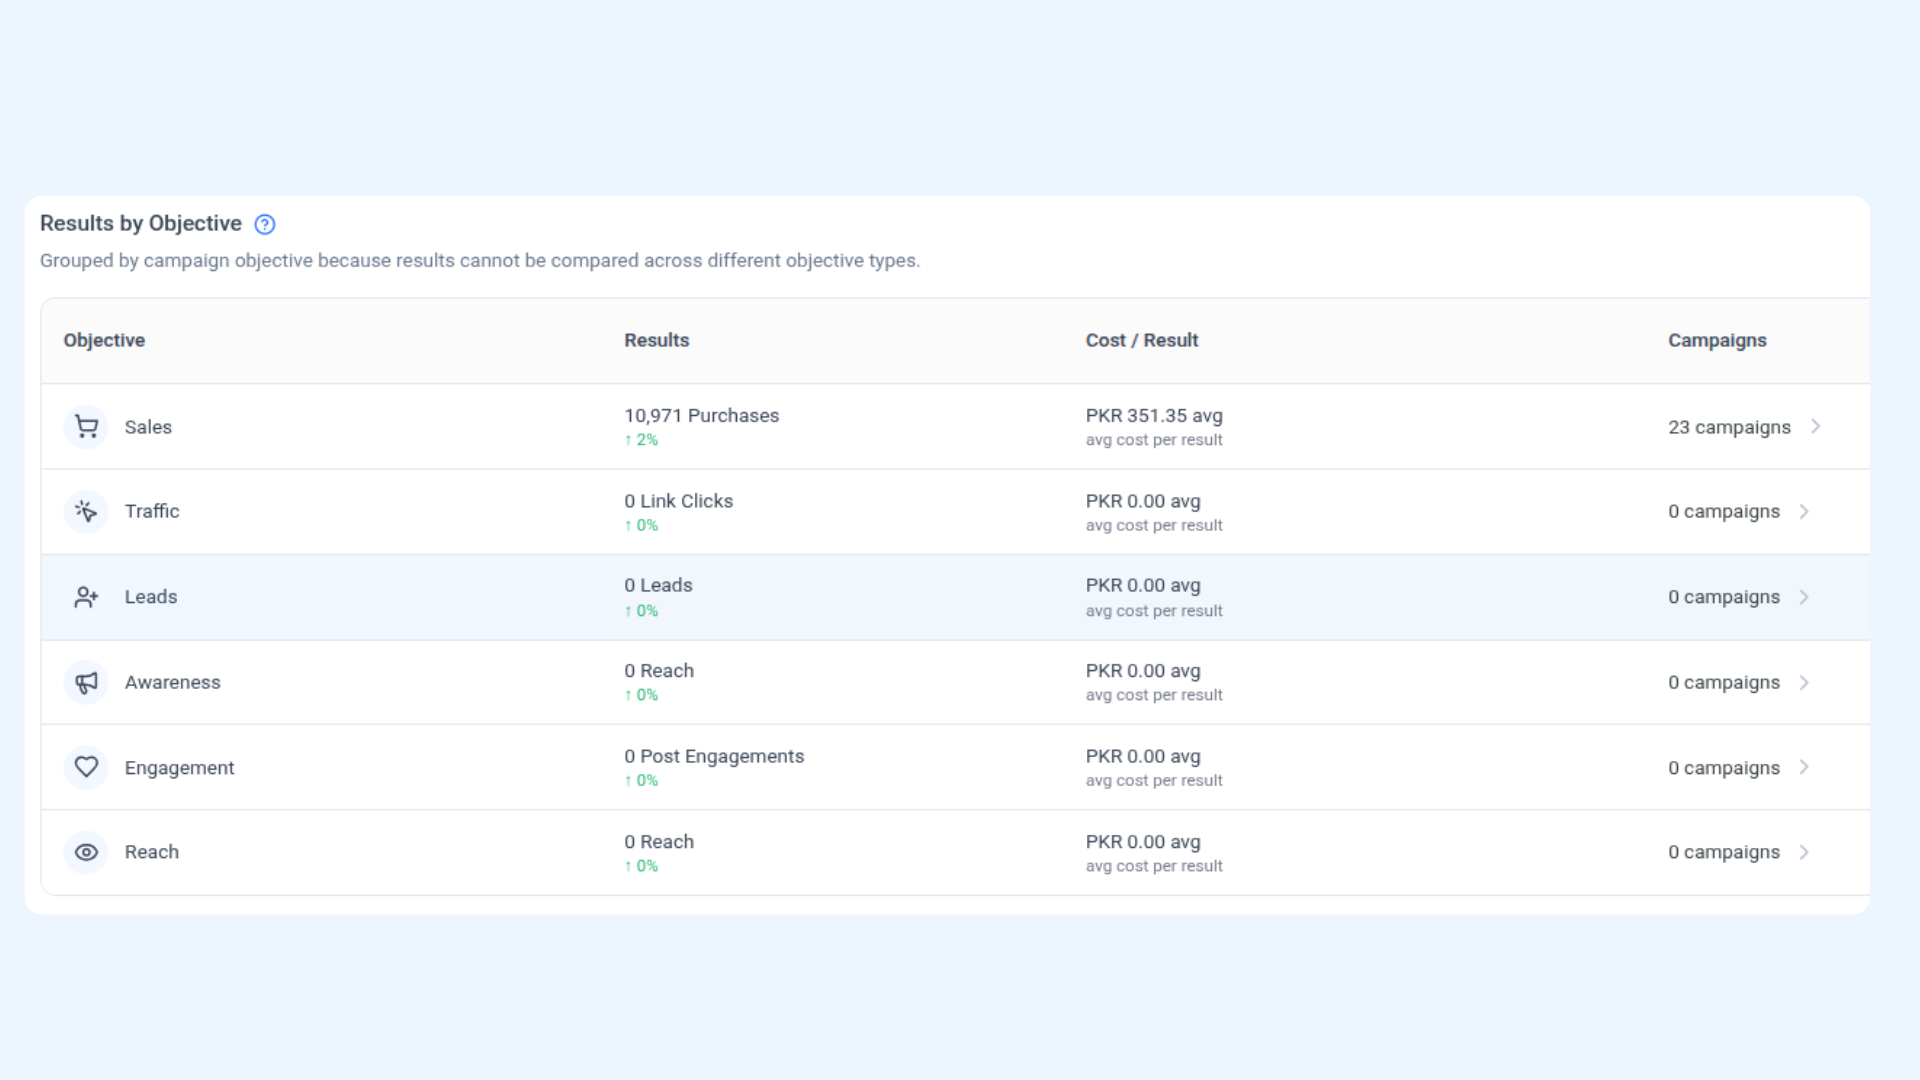
The table at the bottom of the Overview tab groups your campaign results by Meta campaign objective: Sales, Traffic, Leads, Awareness, Engagement, and Reach.
Results are never mixed across different objective types. A Purchase from a Sales campaign and a Link Click from a Traffic campaign measure fundamentally different things — grouping them together would make the numbers meaningless.
Each row shows three things: the total results for that objective type with a period-over-period percentage change, the average cost per result in PKR across all campaigns of that type, and the number of active campaigns running under that objective.
Click the arrow on the right of any row to jump to the Campaigns tab filtered to that specific objective.
Overview — Performance Charts
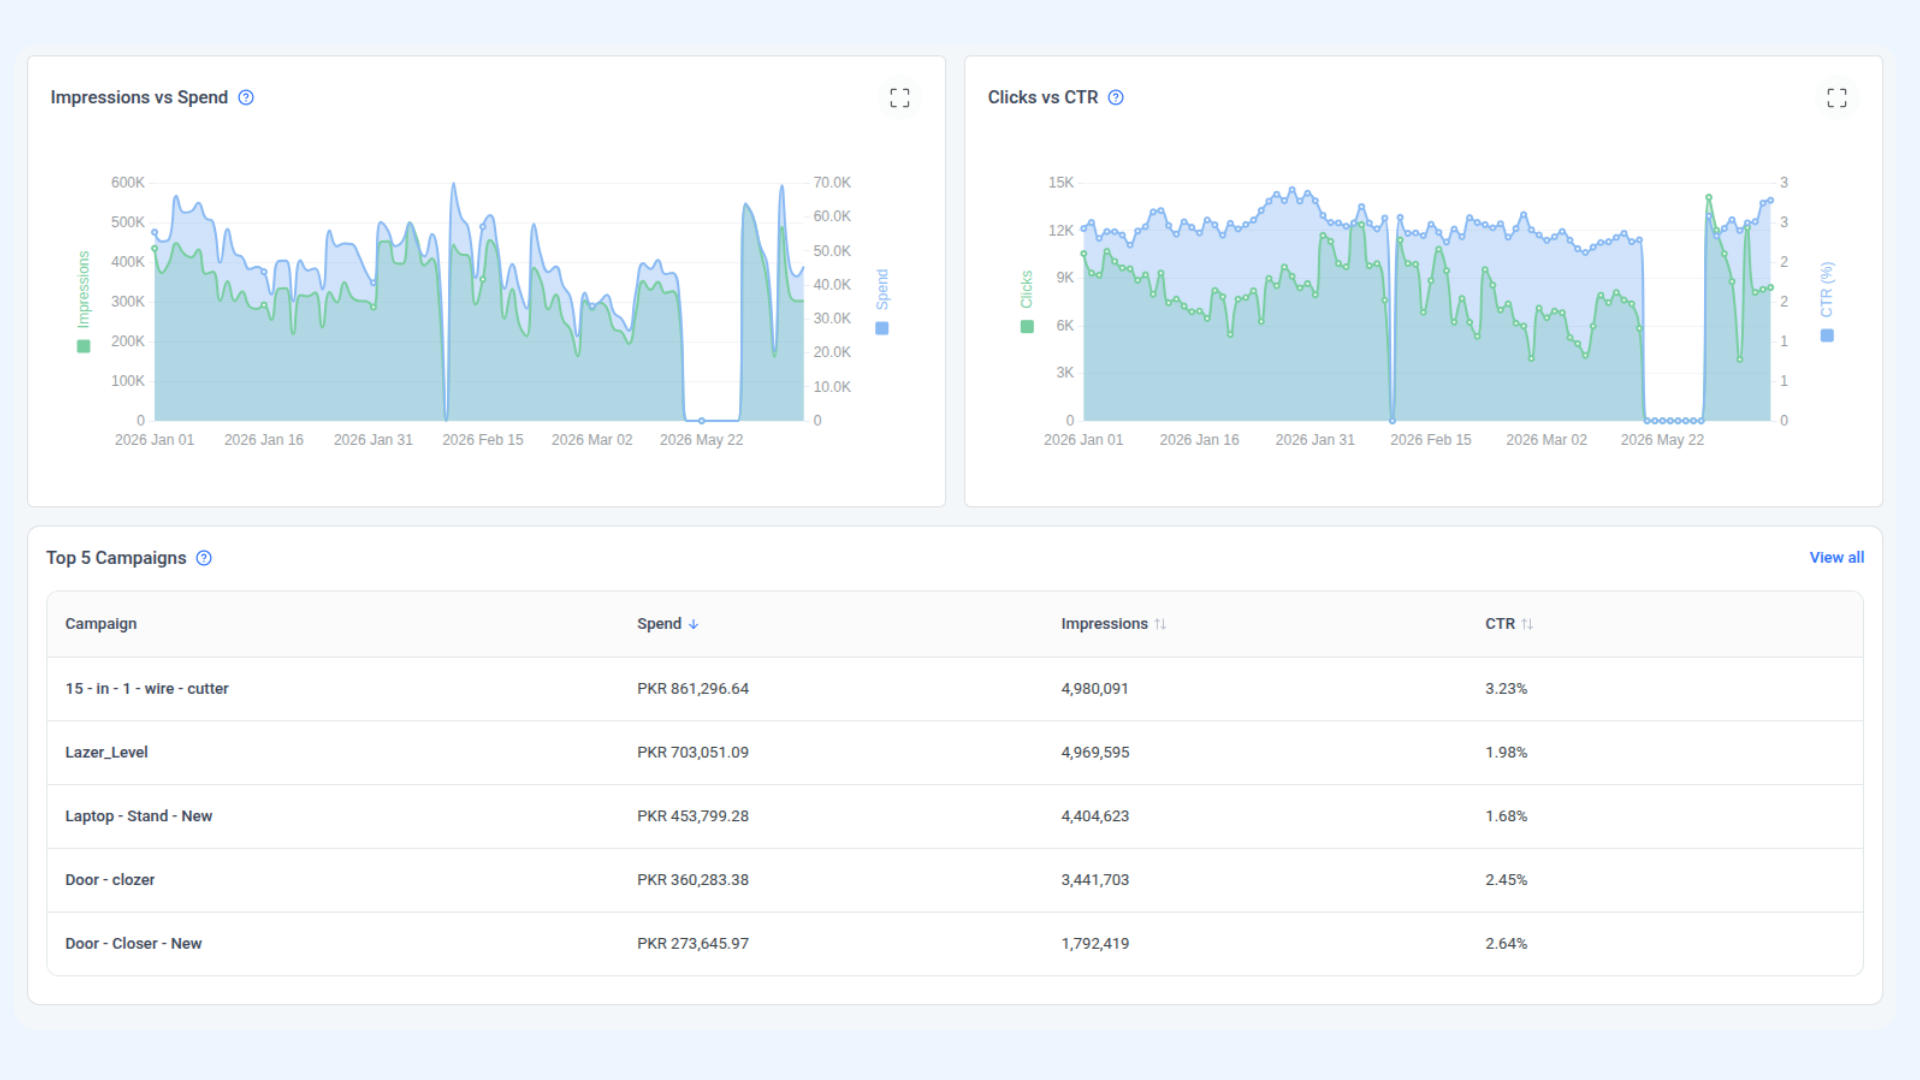
Impressions vs Spend — The first chart plots Impressions (left axis, green line) and Spend (right axis, blue shaded area) together over time. This lets you see whether your delivery and budget are moving in sync.
If spend holds steady but impressions drop, your CPM is rising and you are getting less reach for the same budget. If impressions spike without a spend increase, Meta is finding cheaper inventory.
Clicks vs CTR — The second chart plots Clicks (left axis, green line) against CTR (right axis, blue shaded area) over the same period. This is your primary chart for spotting creative fatigue: if clicks are declining but impressions are stable, CTR is falling — meaning audiences have seen the ad too many times or the creative is no longer resonating.
Hover over any point on either chart to see the exact date and value for that day.
Performance of Meta Ads
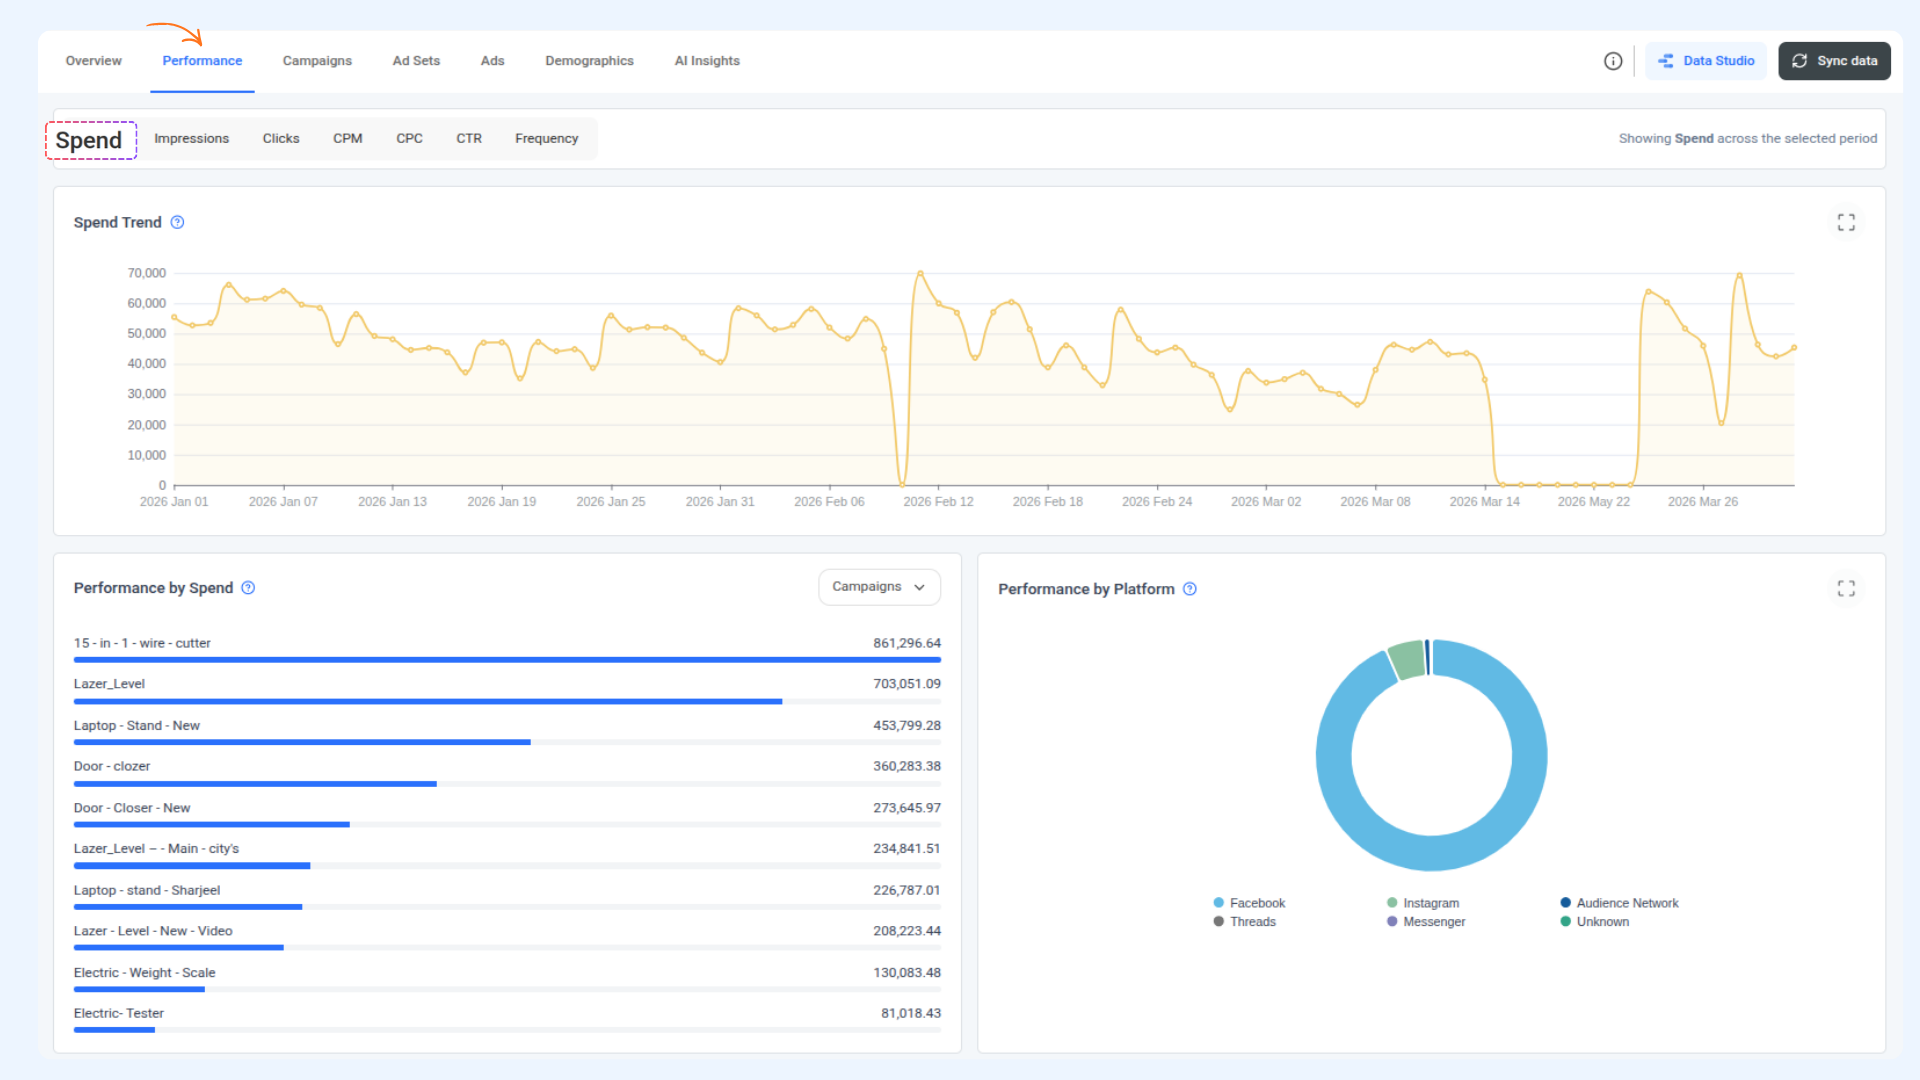
The Performance tab gives you a time-series view of any metric and breaks down how your spend and performance are distributed across campaigns and Meta placements.
Use the seven metric buttons across the top — Spend, Impressions, Clicks, CPM, CPC, CTR, Frequency — to switch the trend chart to show that metric across your selected date range. The active metric is labelled above the chart: "Showing Spend across the selected period."
Spend Trend chart — Plots your selected metric day by day. Peaks and troughs often correspond to campaign pauses, budget changes, or audience saturation events. Hover over any data point to see the exact date and value.
Performance by Spend — A ranked horizontal bar chart below the trend shows your campaigns ordered by total spend, highest first. Use the dropdown (defaulting to Campaigns) to switch the grouping to Ad Sets or Ads. This gives you a fast view of where budget is concentrated at any level.
Performance by Platform — A donut chart on the right shows how total spend is split across Meta's delivery placements. Hover over any segment to see the exact spend and percentage for that surface.
Placement | What It Covers |
|---|---|
Feed, Stories, Reels, Marketplace, Right Column, and other Facebook surfaces | |
Feed, Stories, Reels, and Explore | |
Messenger | Messenger inbox placements |
Threads | Threads feed placements |
Audience Network | Third-party apps and websites in Meta's advertising network |
Unknown | Placements that could not be attributed to a specific surface |
Performance — Impressions
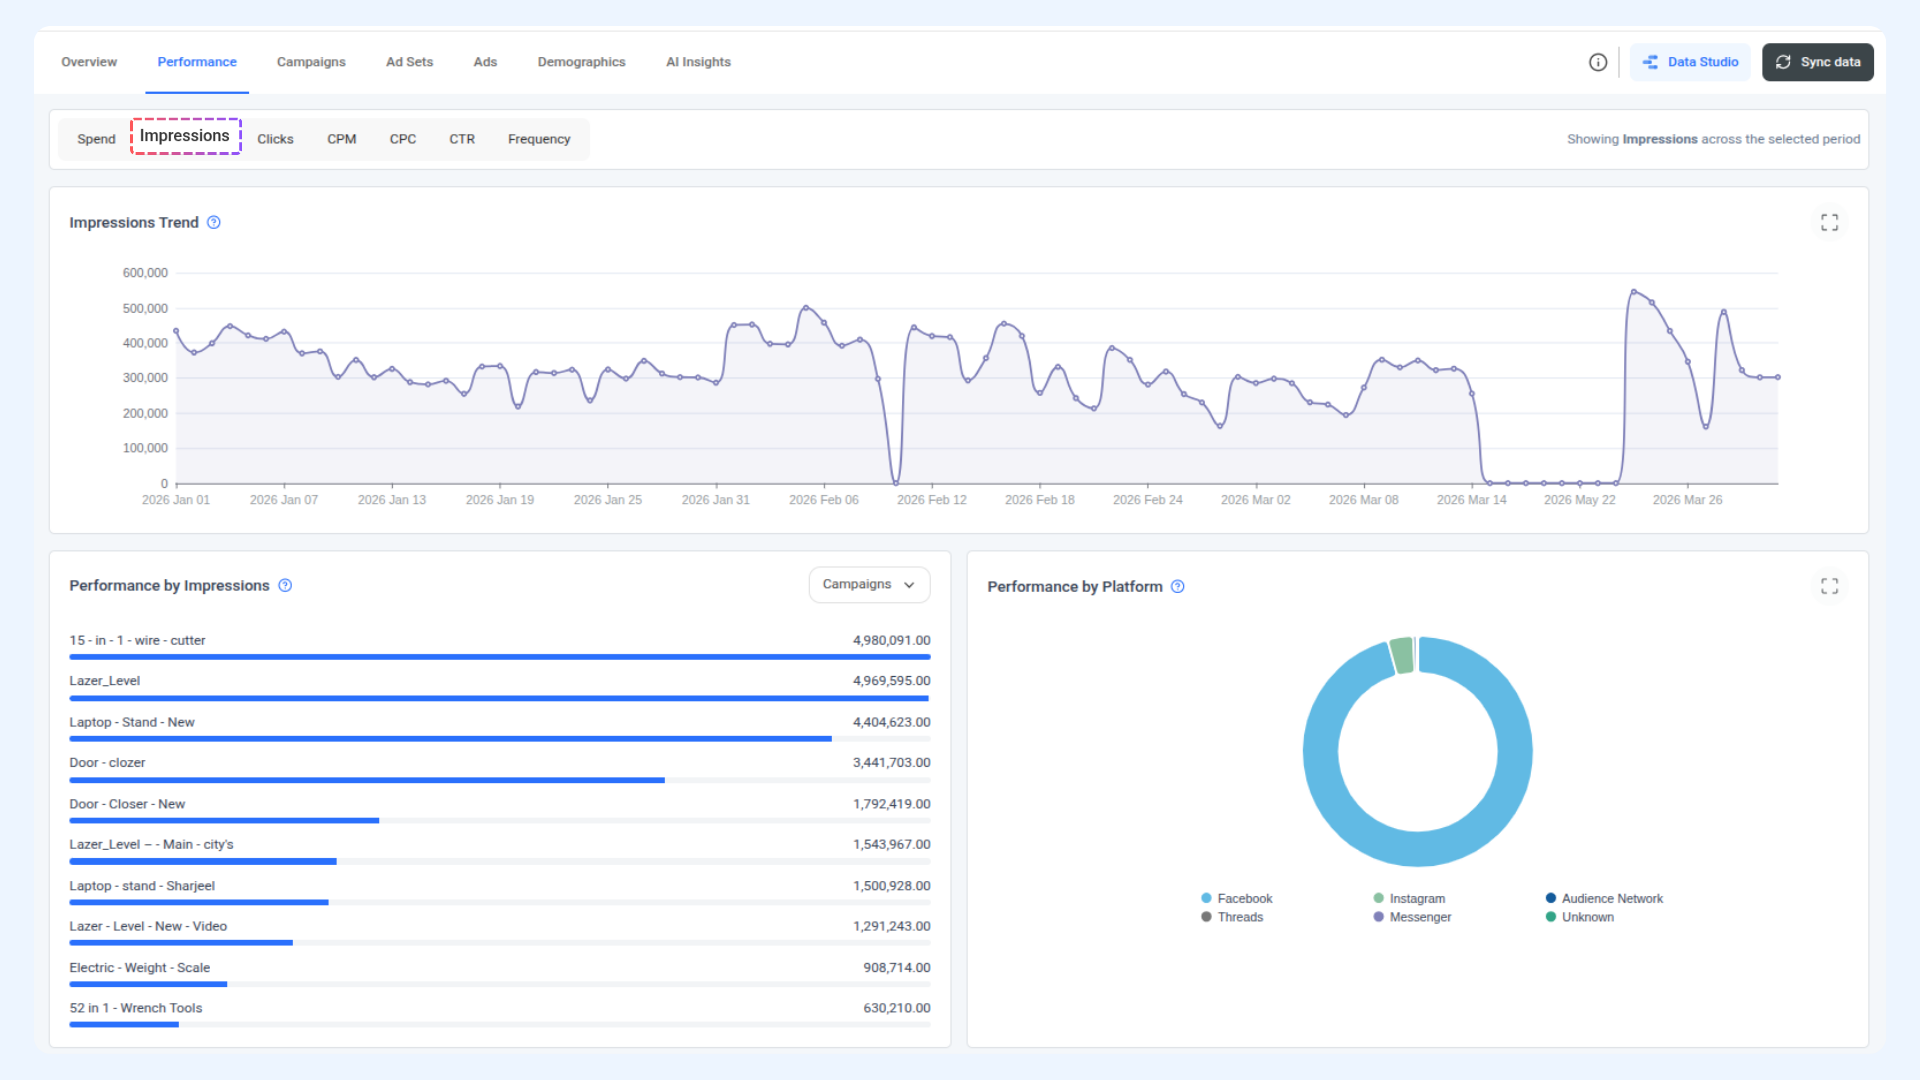
Impressions Trend — Shows how many times your ads were displayed each day across the selected period. Impressions count every view, including multiple views by the same person, so this number will always be higher than your Reach. A steady impressions line with rising spend means your CPM is increasing and you are getting less delivery per rupee spent.
Performance by Spend — A horizontal bar chart ranking your campaigns by total spend, highest first. Use the dropdown to switch between Campaigns, Ad Sets, or Ads to see where budget is concentrated at each level.
Performance by Platform — A donut chart showing how your total spend is distributed across Meta's placements. Hover over any segment to see the exact spend and percentage for that surface.
Performance — Clicks
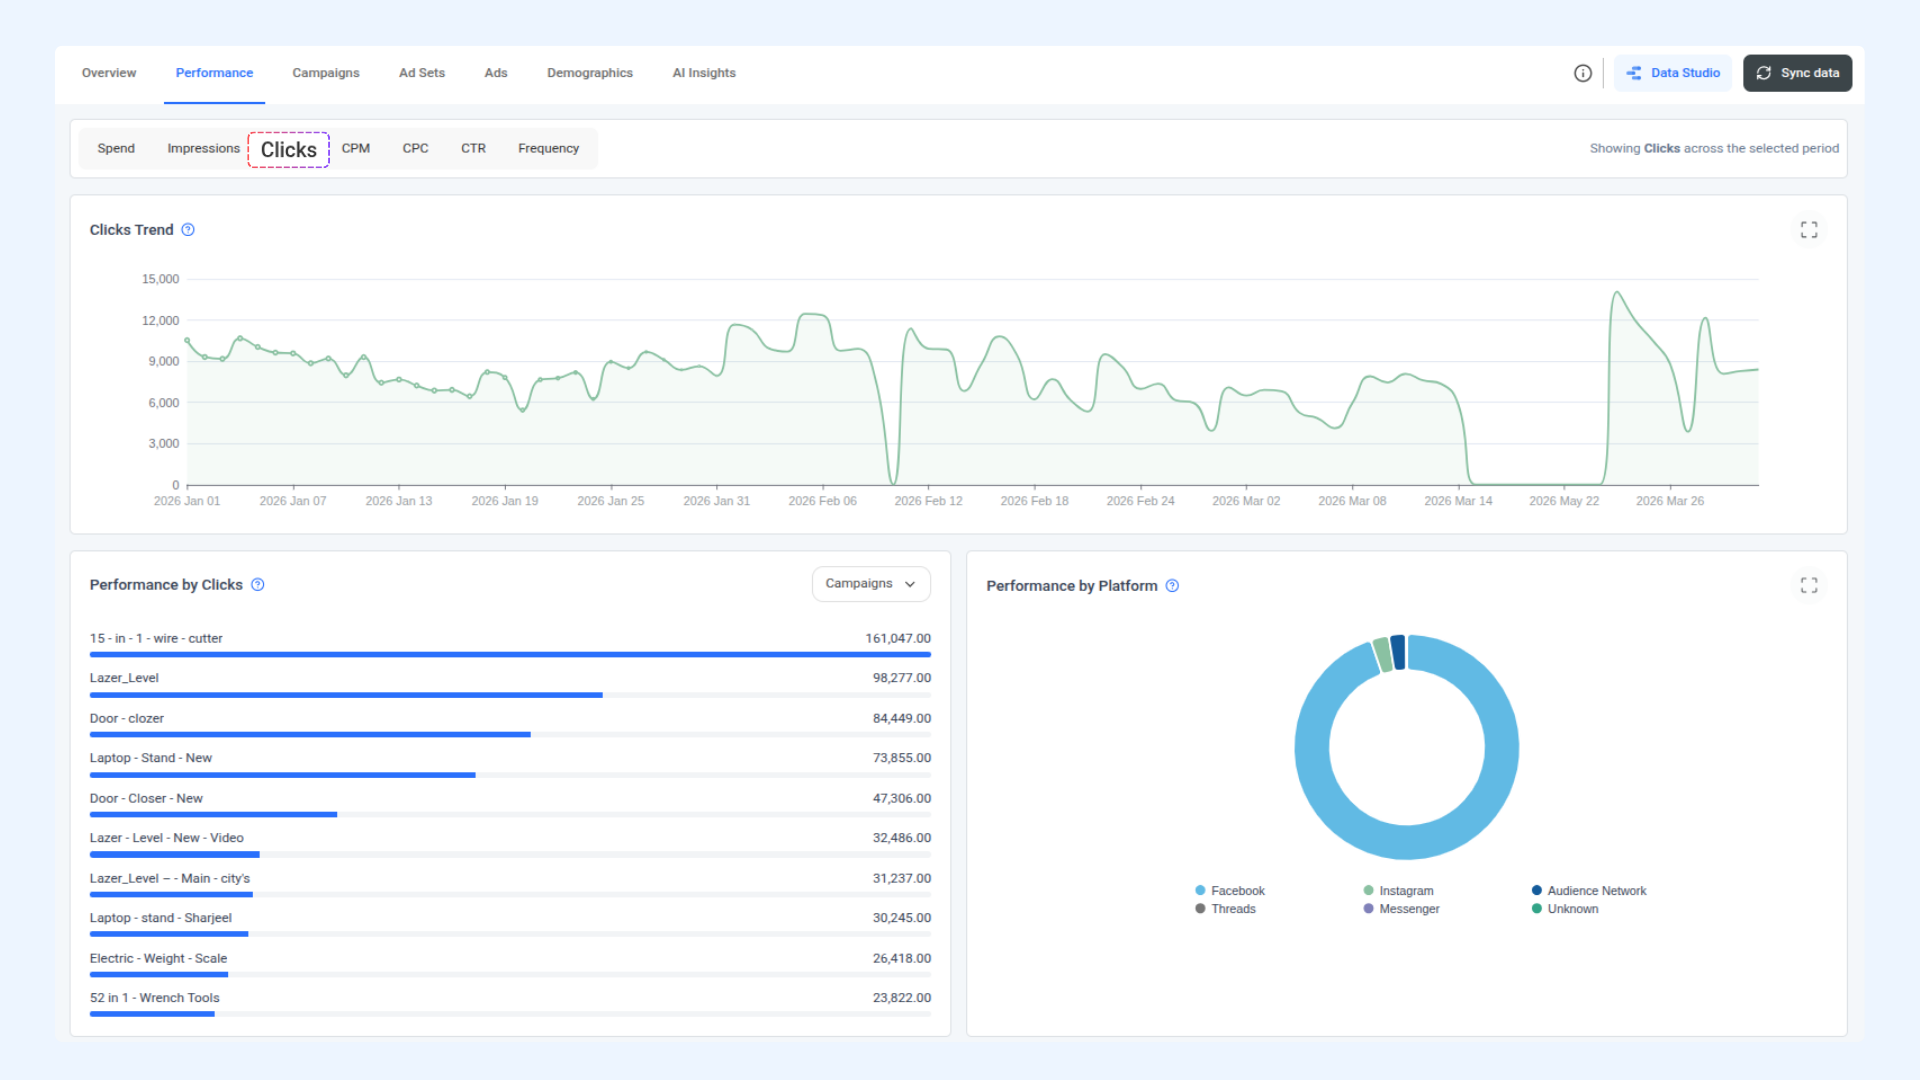
Clicks Trend — Shows the total number of clicks your ads received each day. This includes link clicks, button clicks, and other interactions depending on your campaign objective. A declining clicks trend alongside stable impressions is one of the clearest signs that your creative is losing relevance with your audience.
Performance by Spend — A horizontal bar chart ranking your campaigns by total spend, highest first. Use the dropdown to switch between Campaigns, Ad Sets, or Ads to see where budget is concentrated at each level.
Performance by Platform — A donut chart showing how your total spend is distributed across Meta's placements. Hover over any segment to see the exact spend and percentage for that surface.
Performance — CPM
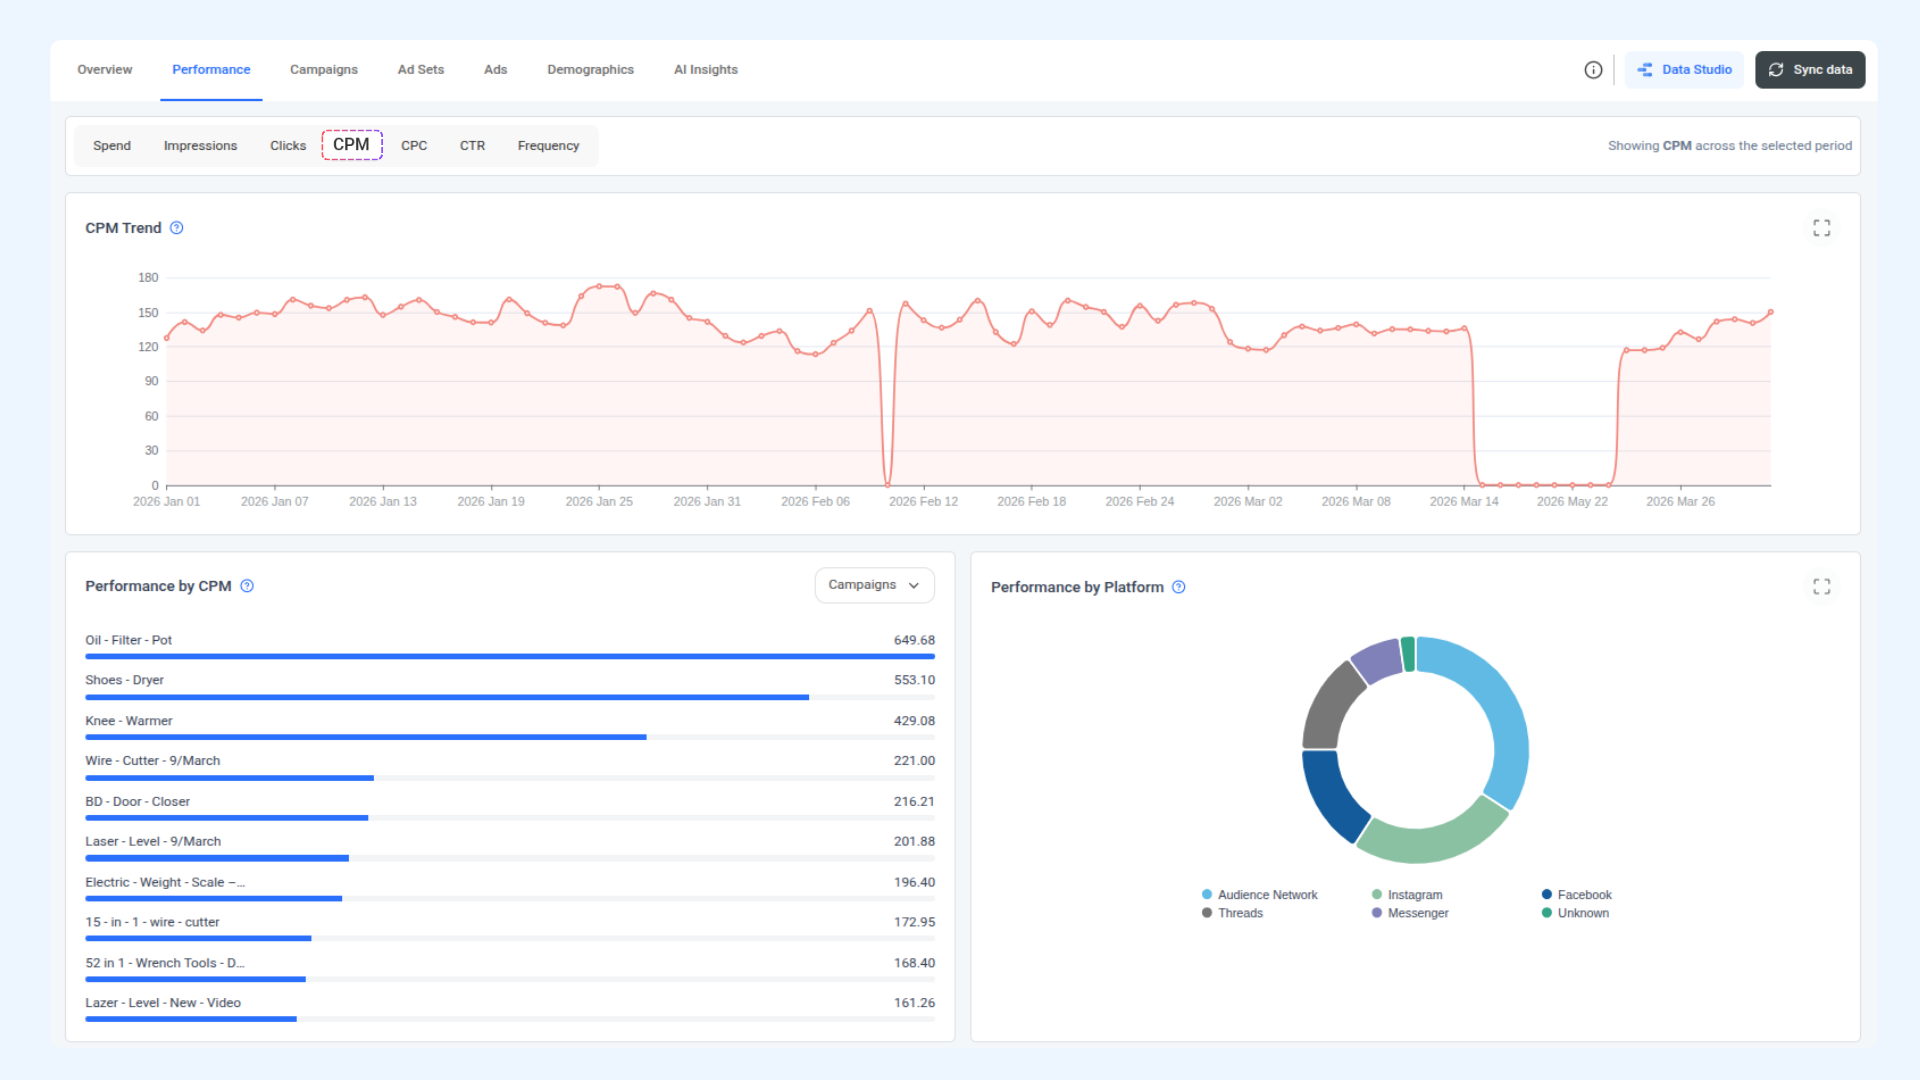
CPM Trend — Shows your cost per 1,000 impressions each day across the selected period. CPM is driven by auction competition, audience size, placement, and your ad's quality score. A rising CPM trend means it is getting more expensive to reach people — either because more advertisers are competing for the same audience or because your ad relevance has declined.
Performance by Spend — A horizontal bar chart ranking your campaigns by total spend, highest first. Use the dropdown to switch between Campaigns, Ad Sets, or Ads to see where budget is concentrated at each level.
Performance by Platform — A donut chart showing how your total spend is distributed across Meta's placements. Hover over any segment to see the exact spend and percentage for that surface.
Performance — CPC
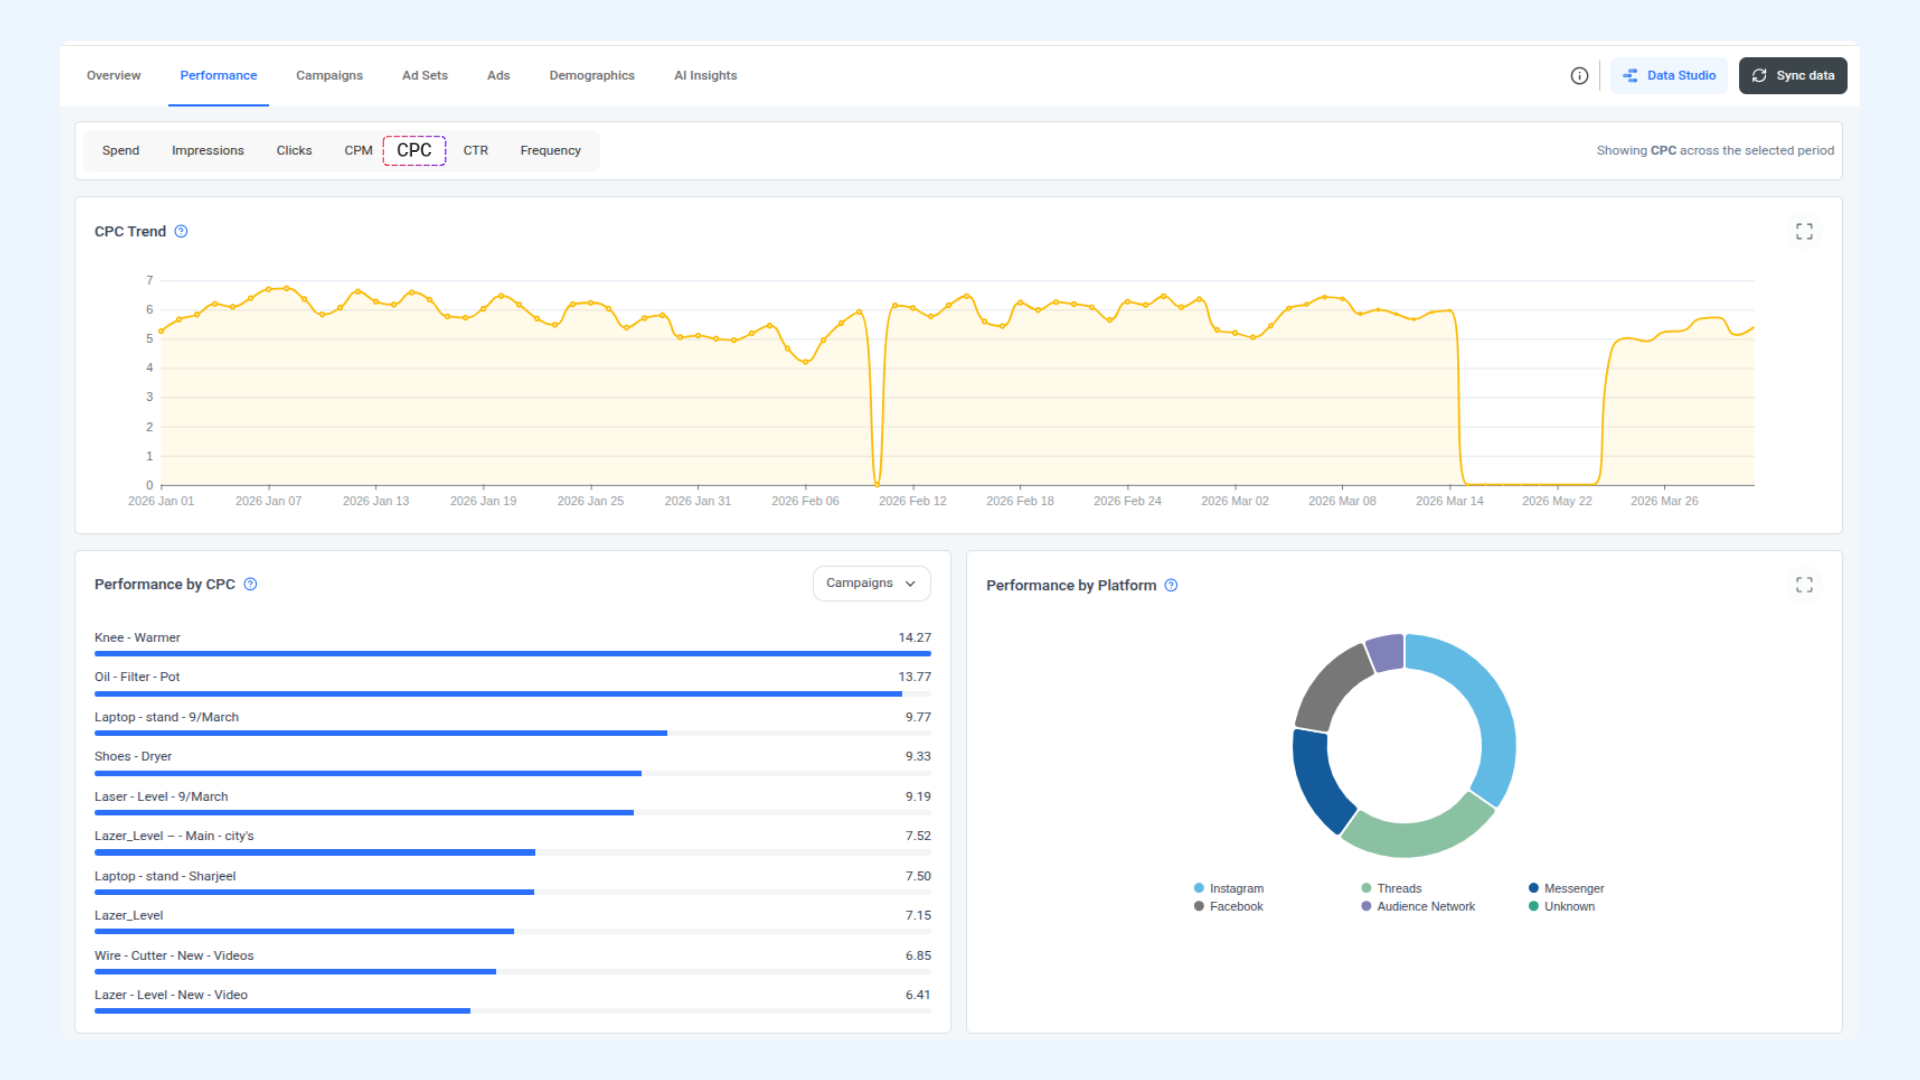
CPC Trend — Shows your average cost per click each day. CPC is a direct product of CPM and CTR: if your CPM rises or your CTR falls, your CPC will increase. A rising CPC trend is usually the first visible sign that a campaign is becoming less efficient and needs attention — either through creative refresh, audience adjustment, or bid changes.
Performance by Spend — A horizontal bar chart ranking your campaigns by total spend, highest first. Use the dropdown to switch between Campaigns, Ad Sets, or Ads to see where budget is concentrated at each level.
Performance by Platform — A donut chart showing how your total spend is distributed across Meta's placements. Hover over any segment to see the exact spend and percentage for that surface.
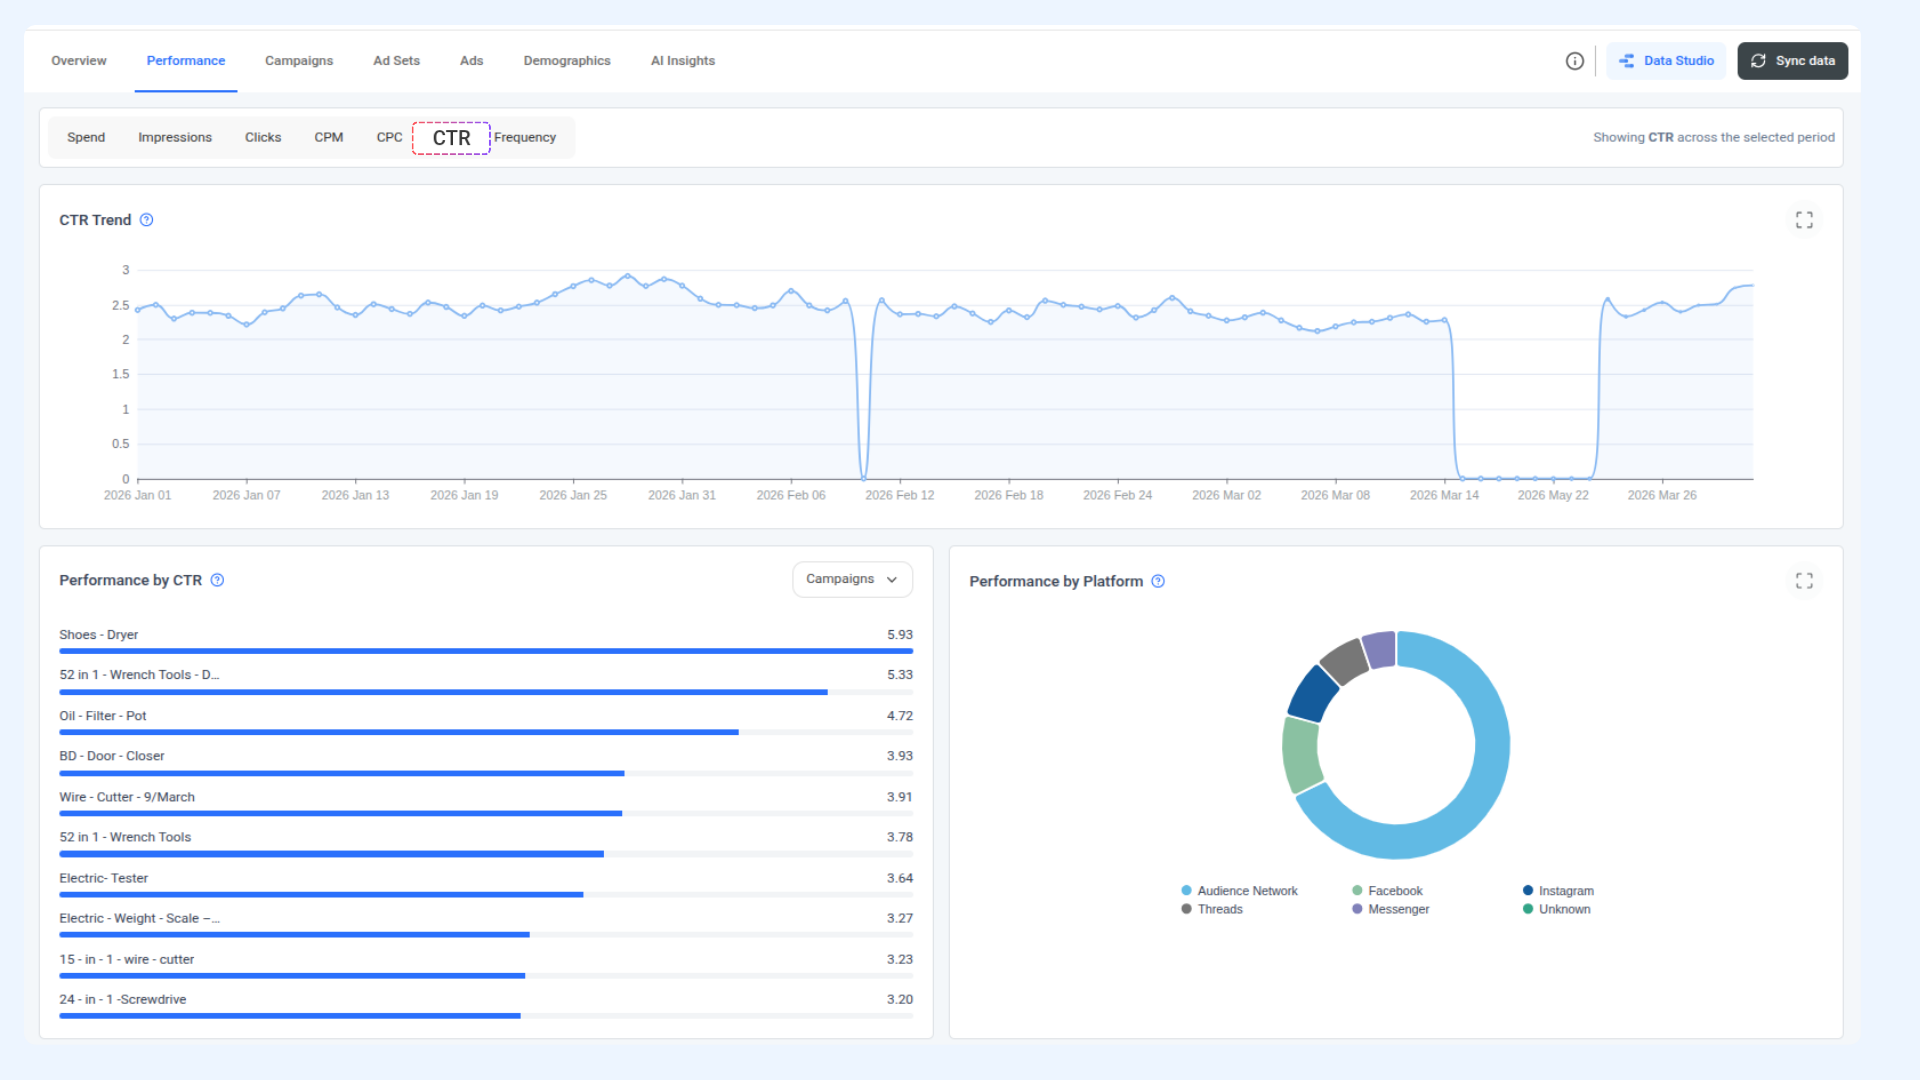
Performance — CTR
CTR Trend — Shows your click-through rate as a percentage of impressions each day. CTR measures how compelling your ads are to the people seeing them. A gradual decline over time almost always means your audience has seen the same creative too many times and is no longer engaging with it. For e-commerce Sales campaigns, a CTR between 1% and 3% is a typical healthy range.
Performance by Spend — A horizontal bar chart ranking your campaigns by total spend, highest first. Use the dropdown to switch between Campaigns, Ad Sets, or Ads to see where budget is concentrated at each level.
Performance by Platform — A donut chart showing how your total spend is distributed across Meta's placements. Hover over any segment to see the exact spend and percentage for that surface.
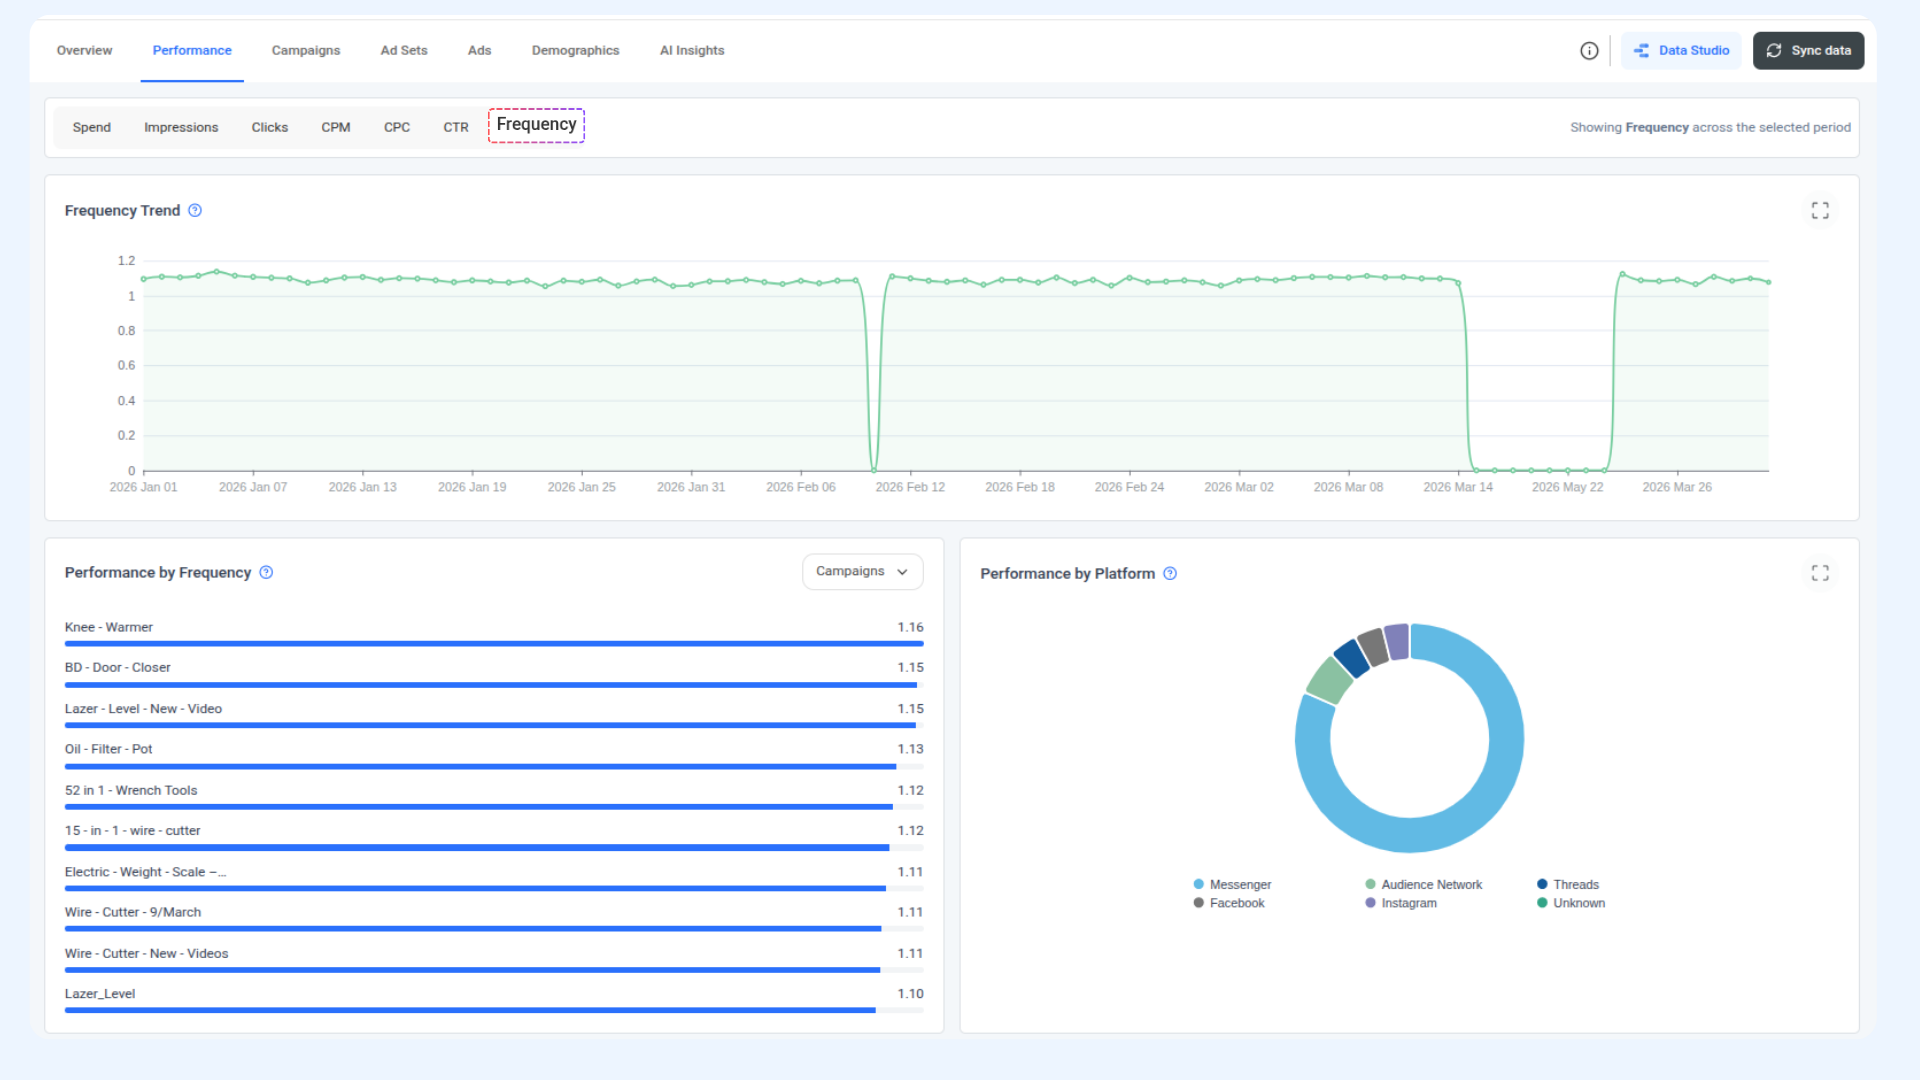
Performance — Frequency
Frequency Trend — Shows the average number of times each person in your audience saw your ads each day. A frequency of 1.0 means everyone saw your ad exactly once. As frequency climbs, the same people are seeing the same ad repeatedly — which initially can reinforce brand recall but will eventually cause CTR to drop as audiences tune the ad out.
Performance by Spend — A horizontal bar chart ranking your campaigns by total spend, highest first. Use the dropdown to switch between Campaigns, Ad Sets, or Ads to see where budget is concentrated at each level.
Performance by Platform — A donut chart showing how your total spend is distributed across Meta's placements. Hover over any segment to see the exact spend and percentage for that surface.
Campaigns in Meta Ads Analytics
The Campaigns tab shows every campaign in your account for the selected period in a sortable, searchable table. By default it shows 1–10 of all campaigns — use pagination at the bottom to move through the full list.
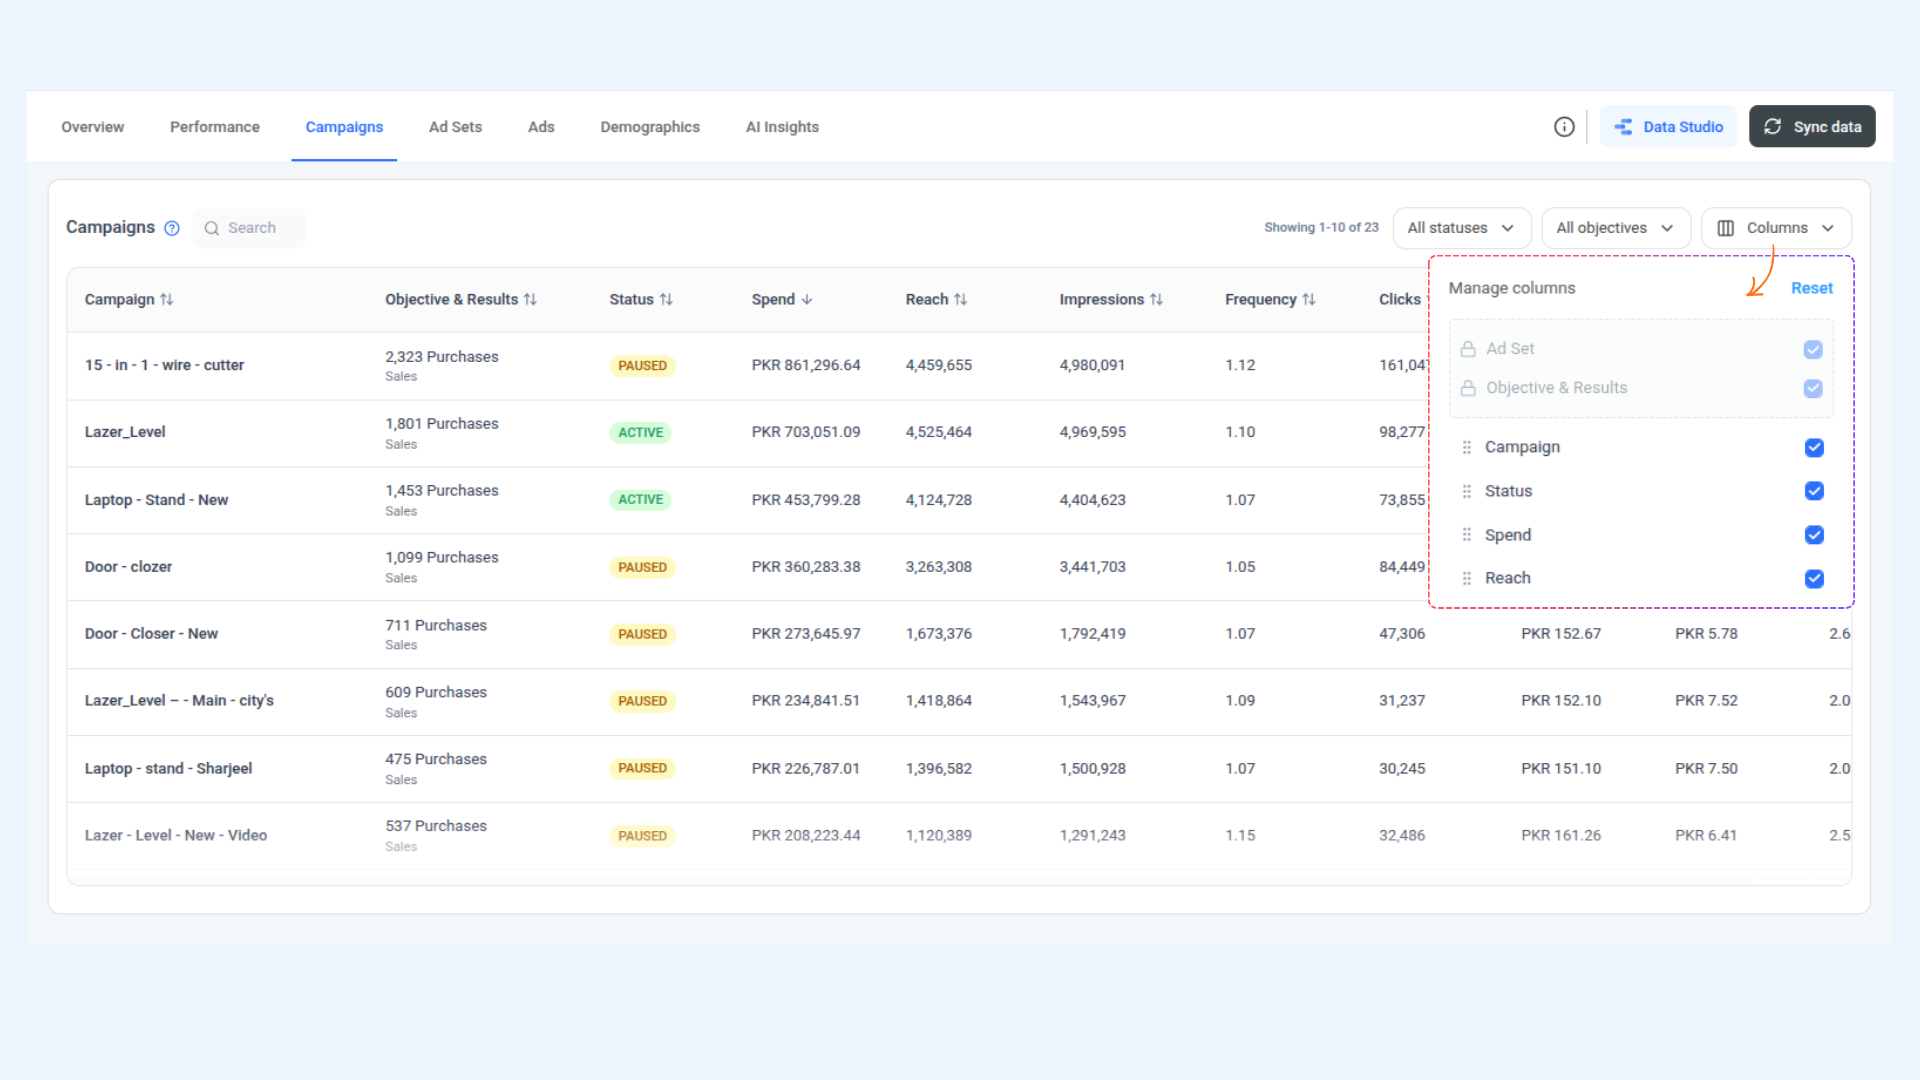
Use the Search bar to find a specific campaign by name. Use the All objectives dropdown to filter the table to a single objective type. Use the Columns button to show or hide additional metrics beyond the defaults.
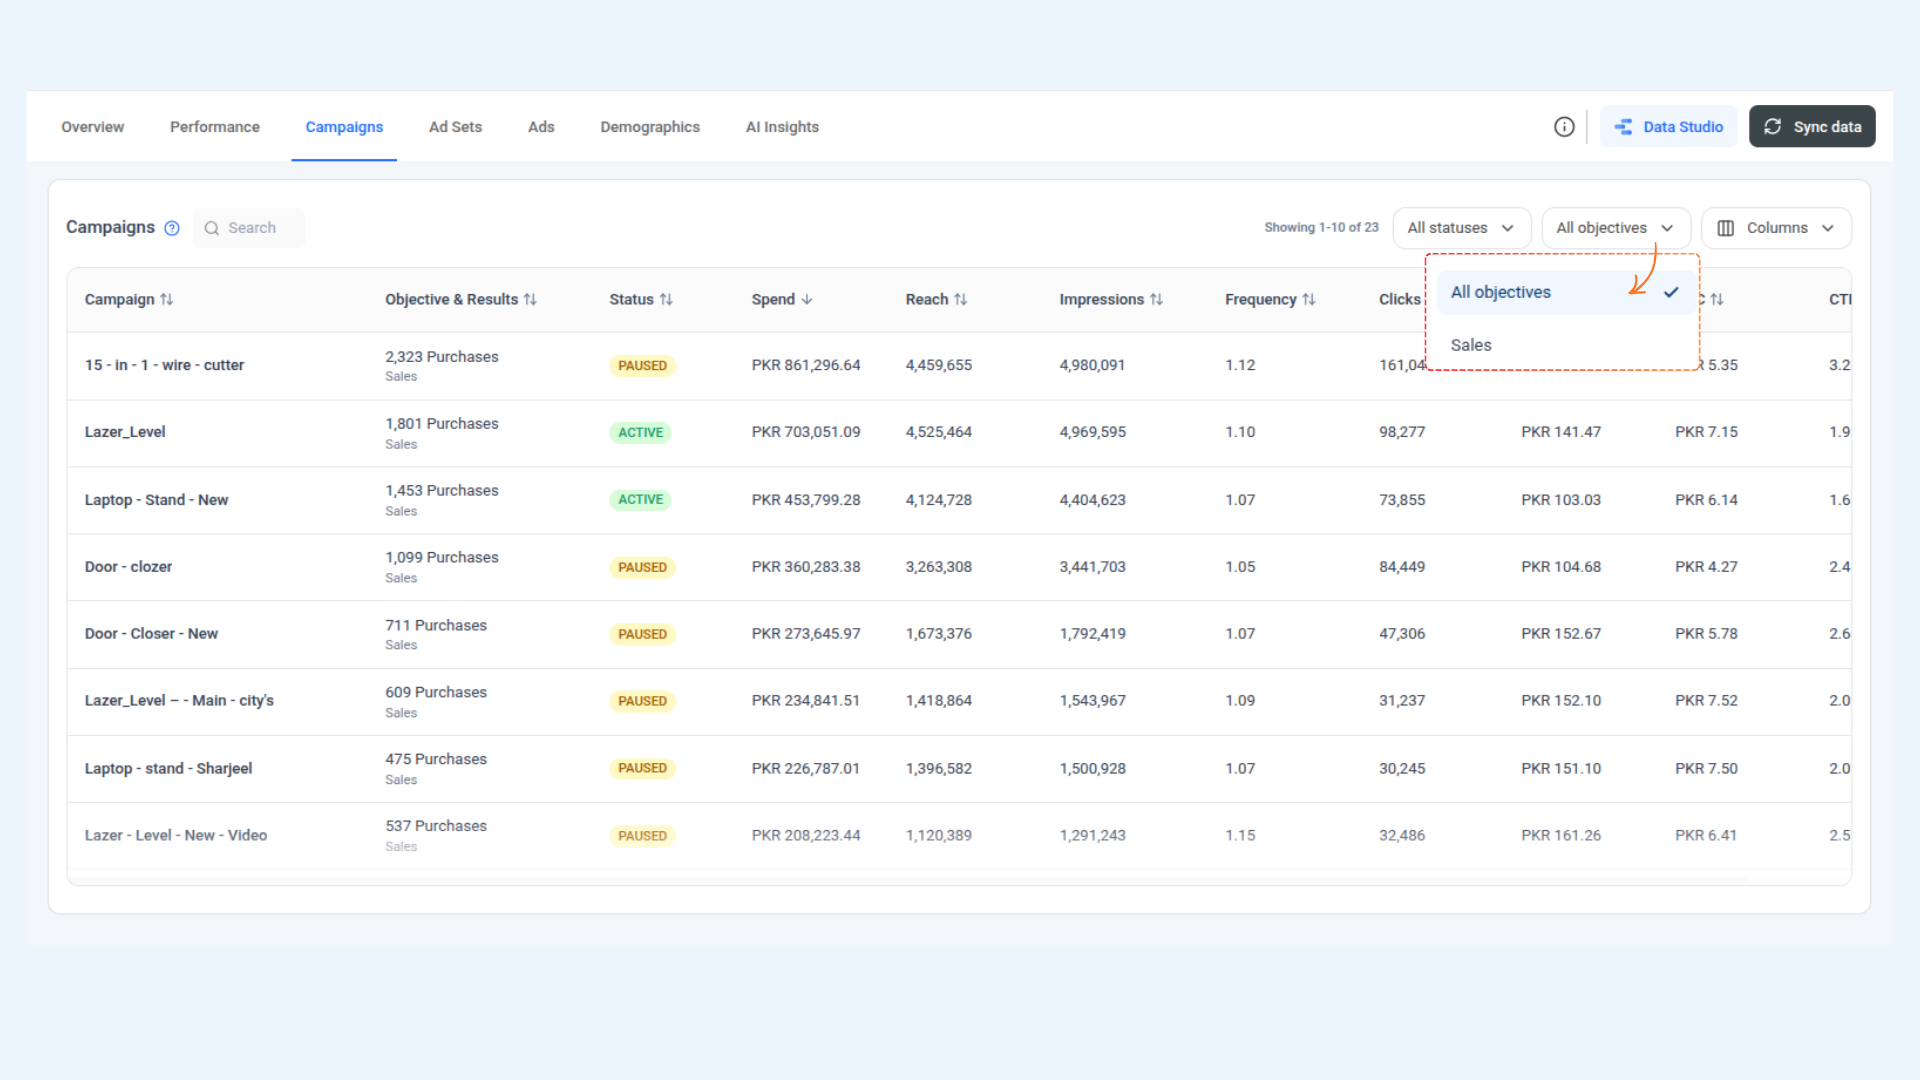
Click any column header to sort the entire table by that metric in ascending or descending order. This lets you instantly find your highest-spend campaigns, lowest-CPC performers, or highest-CTR campaigns in one click.
Column | What It Shows |
|---|---|
Campaign | Campaign name, sortable alphabetically |
Objective & Results | The result type Meta is optimising for (e.g. Purchases) and total results. A green or red percentage below shows the change versus the previous period |
Spend | Total PKR spent on this campaign in the selected period |
Reach | Unique accounts reached by this campaign |
Impressions | Total ad impressions delivered by this campaign |
Frequency | Average number of times each person in the audience saw an ad from this campaign. Values above 2.5 can indicate audience fatigue |
Clicks | Total clicks on ads in this campaign |
CPM | Cost per 1,000 impressions for this campaign |
CPC | Average cost per click for this campaign |
CTR | Click-through rate as a percentage of impressions |
Ad Sets
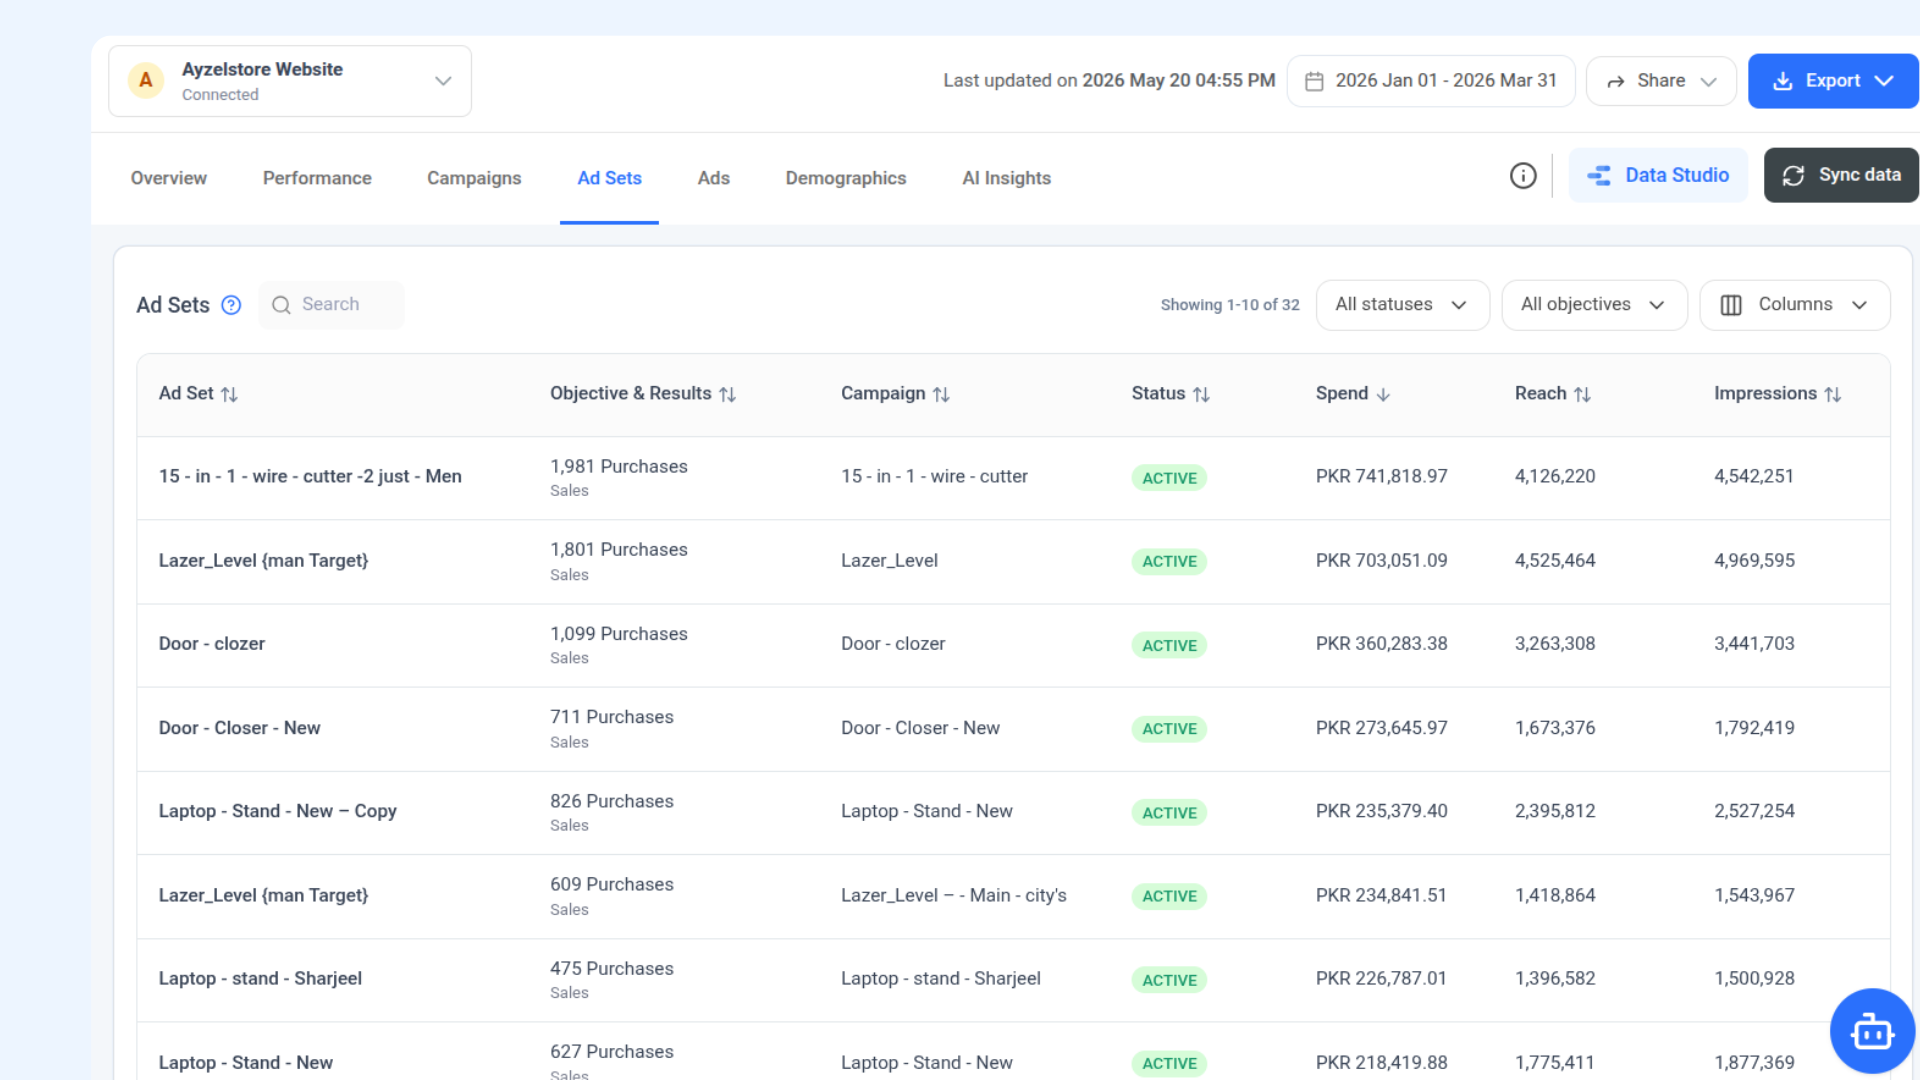
The Ad Sets tab mirrors the Campaigns tab structure but goes one level deeper, showing performance for each individual ad set across all campaigns. By default it shows 1–10 of all ad sets — use pagination to see more.
An additional Campaign column shows which parent campaign each ad set belongs to, so you can understand context without navigating away.
All other columns — Objective & Results, Spend, Reach, Impressions, Frequency, Clicks, CPM, CPC, CTR — are identical to the Campaigns tab and behave the same way. Click any column header to sort.
Ads Tab
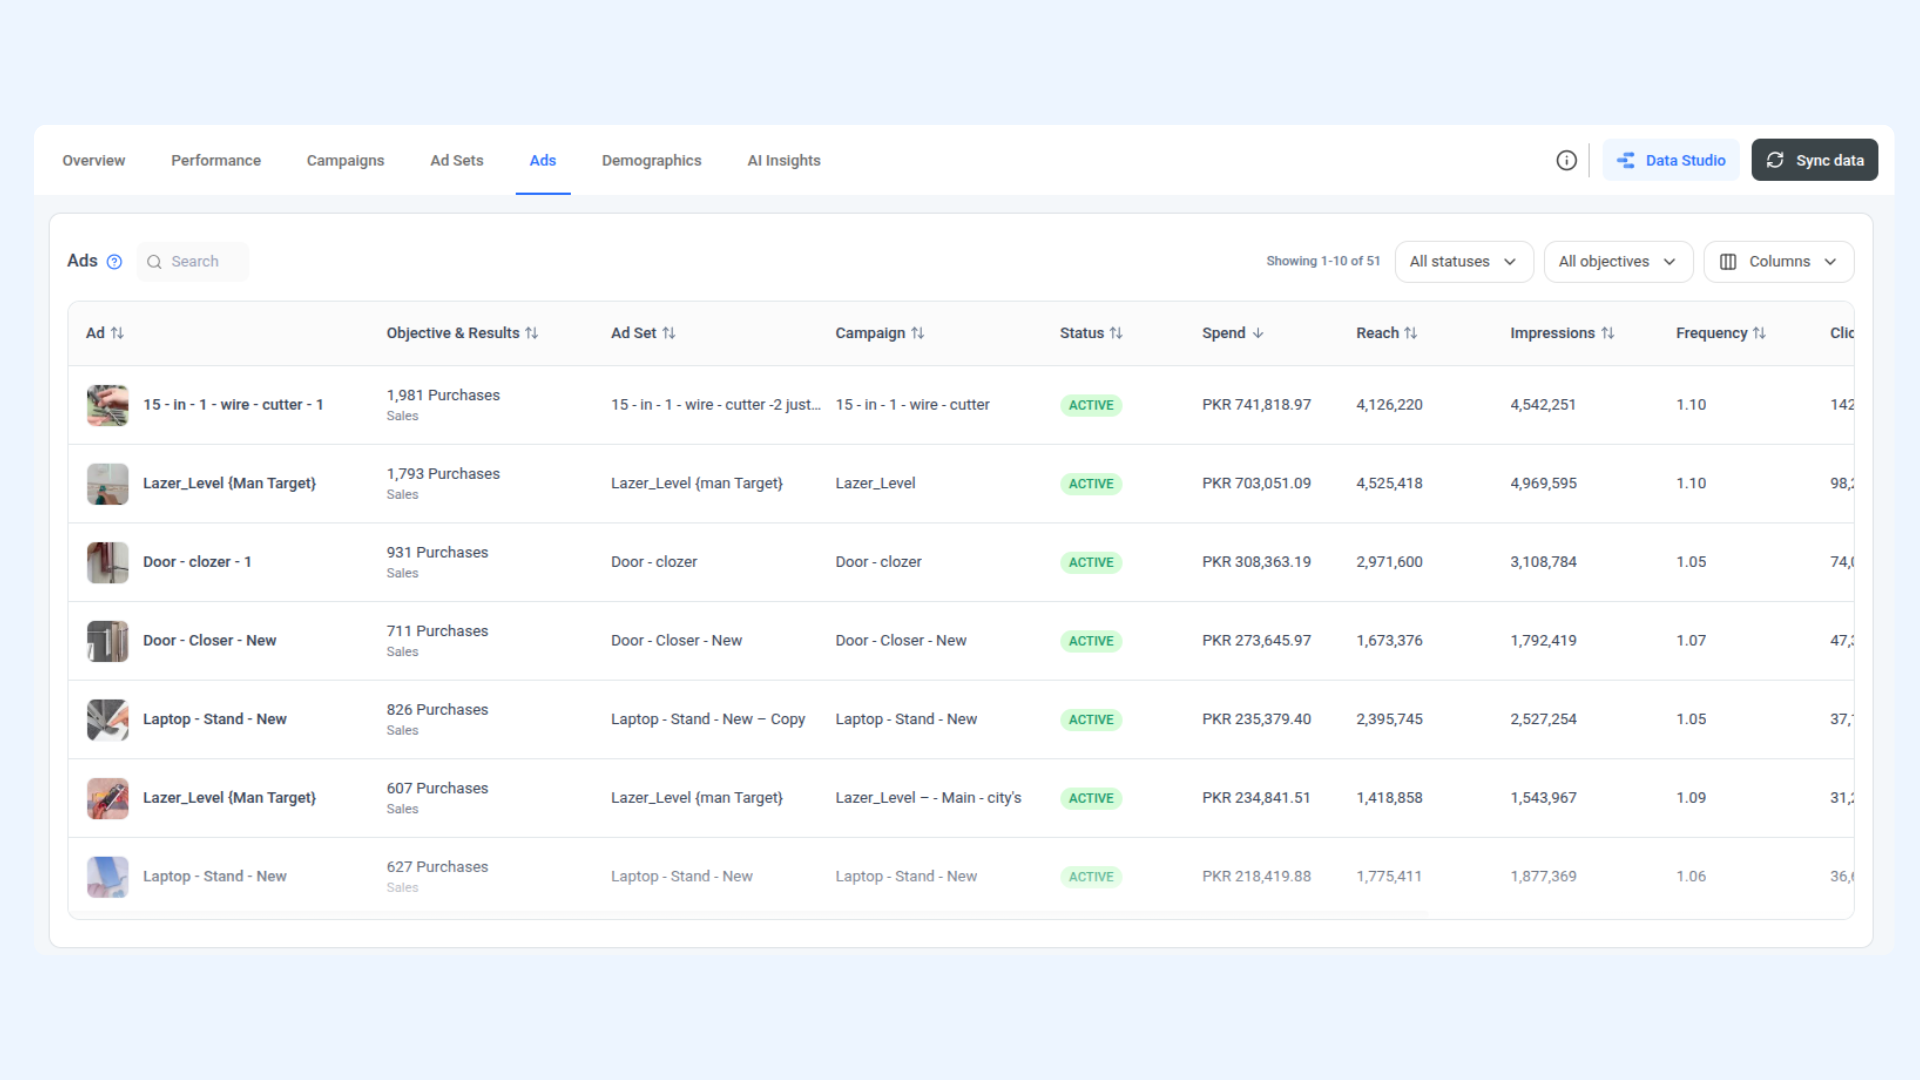
The Ads tab shows performance for every individual ad creative in your account for the selected period, with a thumbnail image on the left of each row to help you identify creatives at a glance. By default it shows 1–10 of all ads.
Each row shows the Ad (thumbnail + name), Objective & Results, Ad Set, Campaign, Spend, Reach, Impressions, Frequency, Clicks, CPM, and CPC.
This is where you identify which specific creatives are driving results. If two ads in the same ad set have significantly different CPCs, the lower-CPC ad is delivering more efficiently and may be a candidate for increased budget, while the higher-CPC ad may need a creative refresh or should be paused.
Demographics
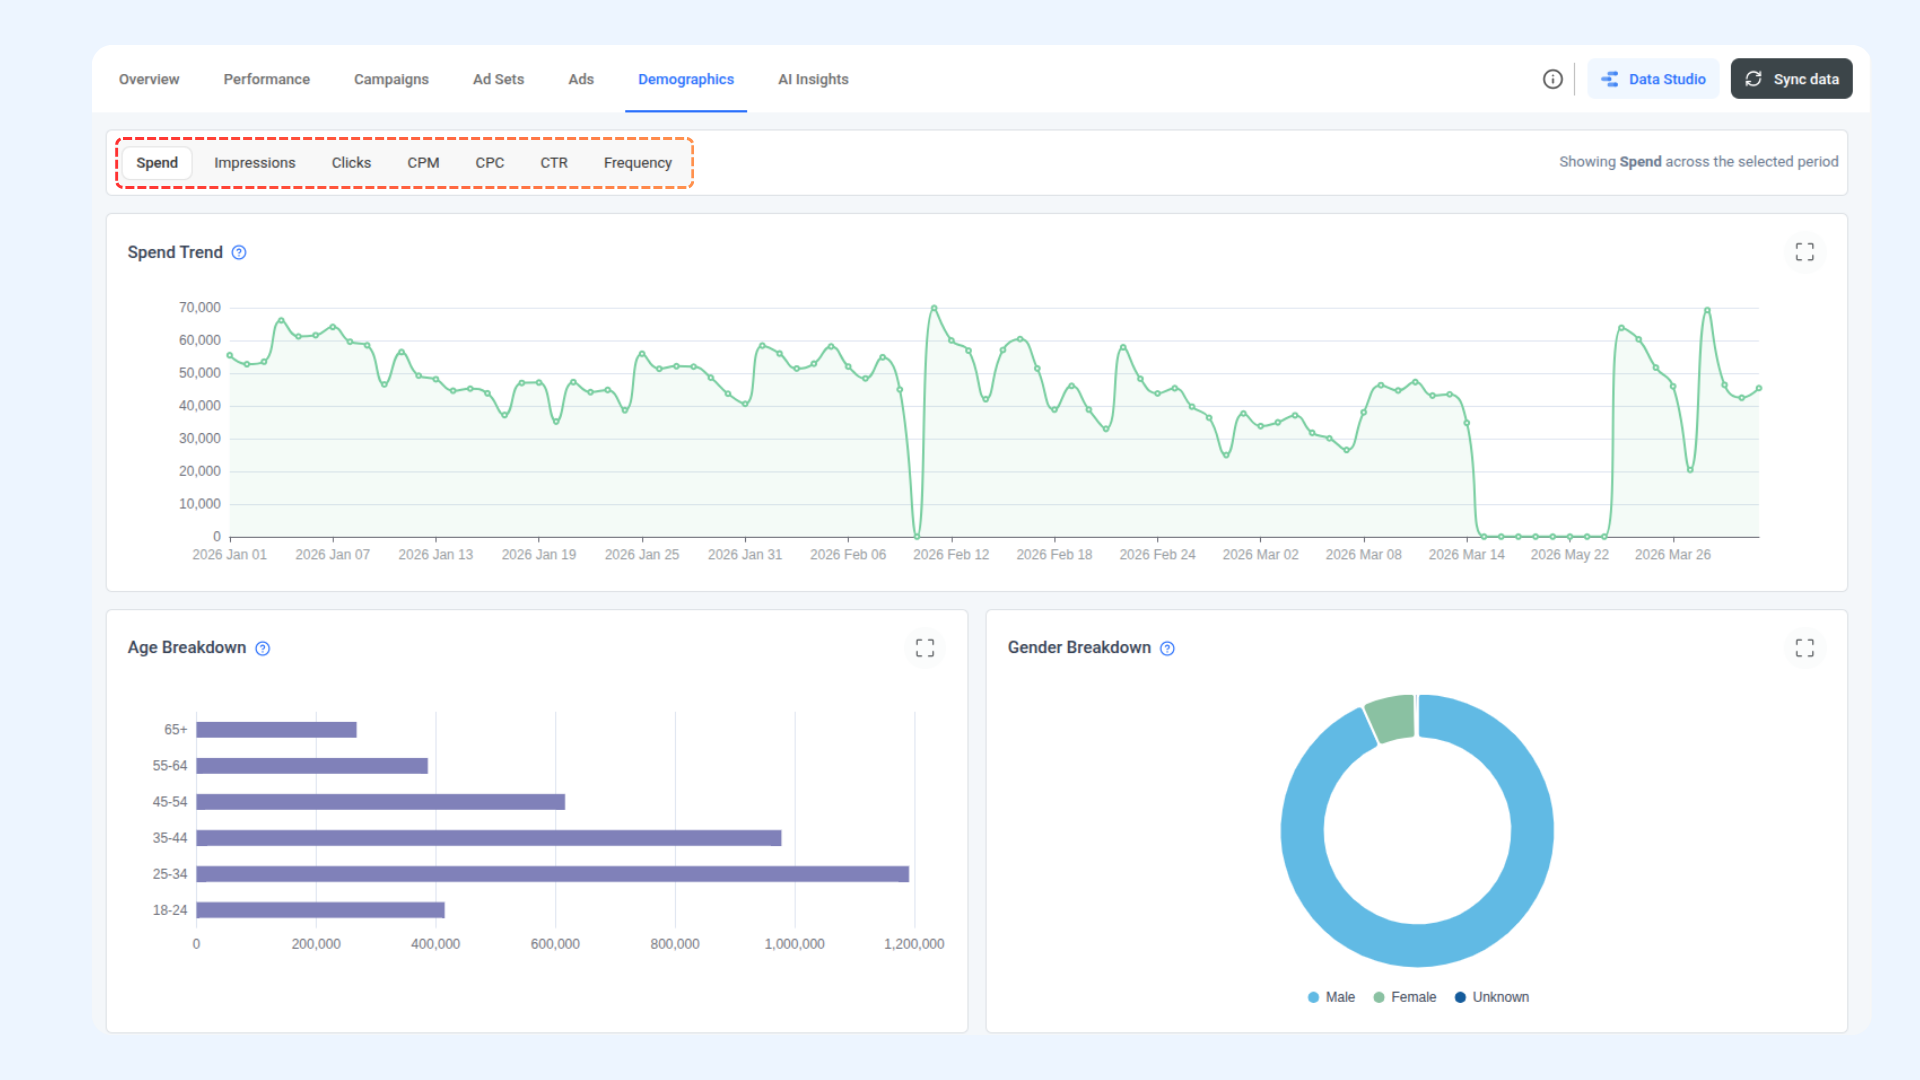
The Demographics tab shows who your ads are actually reaching — broken down by age, gender, and geography. The same Spend Trend chart and metric selector buttons from the Performance tab appear at the top so you can view any metric's trend while reviewing audience data.
Age Breakdown — A horizontal bar chart shows spend distribution across six age brackets: 18–24, 25–34, 35–44, 45–54, 55–64, and 65+. The length of each bar reflects relative spend toward that group. This tells you which age segments Meta is prioritising for your ad delivery.
Gender Breakdown — A donut chart shows the split between Male, Female, and Unknown. Unknown represents people whose gender Meta could not determine, typically due to privacy settings.
By Country / By Region — Switch between the two tabs below the demographic charts to see a geographic breakdown. The By Country table shows Spend, Impressions, Clicks, and CTR per country. The By Region tab breaks this down further to province or state level — useful for identifying geographic pockets with strong performance or high spend but low CTR.
AI Insights — Account Health & Performance Readout
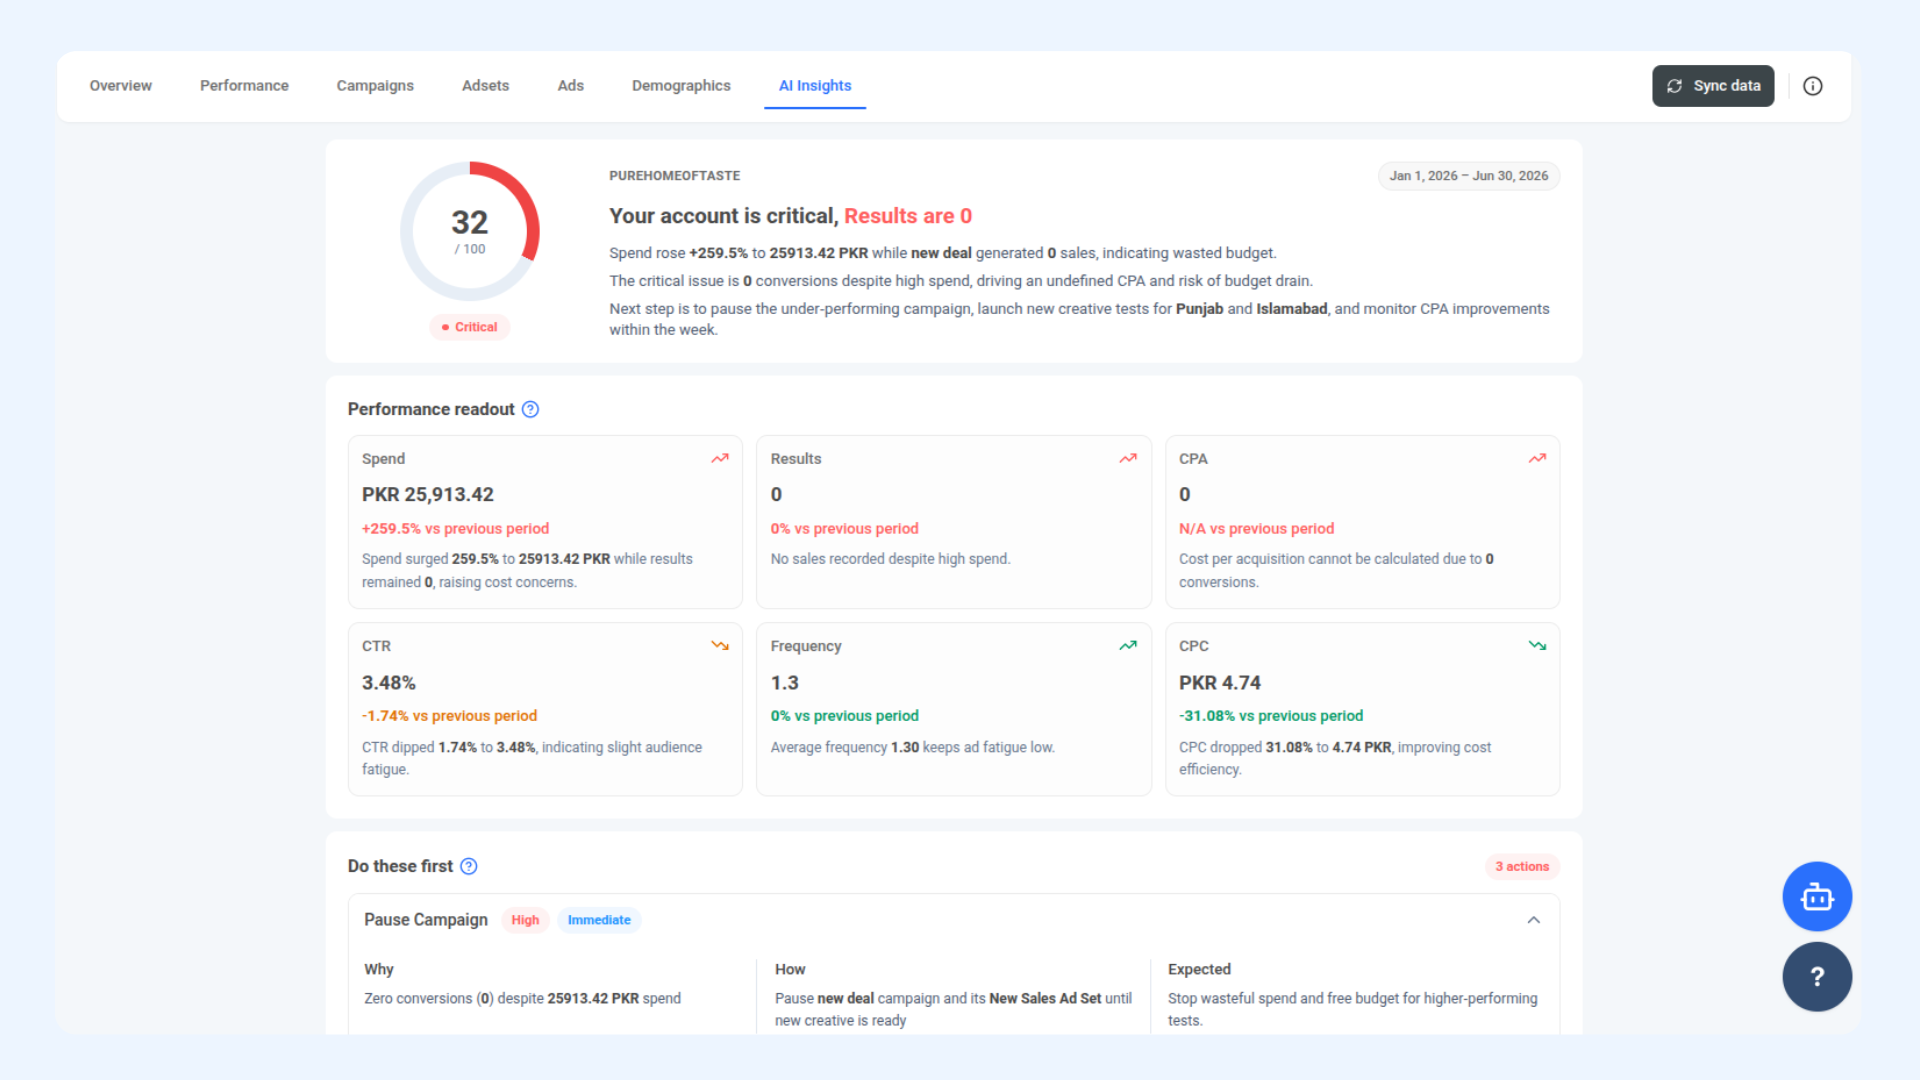
The AI Insights tab is a full automated analysis of your account for the selected period. It identifies what the numbers mean, where the problems are, and exactly what to do about them — in plain language.
Account Health Score — A circular gauge in the top-right corner gives your account an overall health rating out of 100. A score of 55 is labelled Needs attention in orange, meaning meaningful inefficiencies exist that should be addressed. The score reflects the combined state of spend efficiency, CTR trend, CPA direction, frequency, and ROAS.
Performance Readout — Six metric cards show Spend, Results, CPA, CTR, Frequency, and ROAS. Each card displays the current value, a directional arrow, the percentage change versus the previous period, and a one-sentence explanation of what the trend means in plain language.
Metric | Arrow Direction | What It Means |
|---|---|---|
Spend | Down (red) | Spend decreased, reflecting tighter budgeting but also a drop in overall reach |
Results | Down (red) | Sales results fell, signalling a conversion slowdown that needs attention |
CPA | Up (red) | Cost per acquisition rose — an upward arrow on CPA is a negative signal, meaning each conversion is costing more |
CTR | Down (red) | Overall CTR slipped, indicating reduced ad relevance or early-stage creative fatigue |
Frequency | Flat | Frequency remained stable at 1.1, suggesting limited ad fatigue at this time |
ROAS | Flat (risk) | ROAS is 0.0034, far below profitability targets — this usually points to missing conversion value data in the Meta Pixel |
Exporting Data
Click Export in the top-right corner of any tab to download the data currently shown. The export reflects the active tab and your selected date range. Use this to pull campaign tables into spreadsheets, share raw numbers with clients, or feed data into your own reporting templates.
FAQs
Why are Traffic, Leads, Awareness, and Engagement showing 0 results?
The Results by Objective table only shows data for objectives with active campaigns in the selected period. If your account only ran Sales campaigns in that window, all other rows will show zero. This is expected — it is not a data error.
What does a Frequency of 1.07 mean?
It means the average person in your targeted audience saw your ad just over once during the selected period. Frequency below 2.0 is generally healthy. As it climbs above 2.5–3.0, CTR typically starts to drop because the same people are seeing the same ad repeatedly — a signal to refresh creatives or expand your audience.
Why is ROAS showing as 0.0?
ROAS requires conversion value data to be sent back to Meta through the Meta Pixel or Conversions API. If your pixel is not passing purchase values, Meta cannot calculate revenue and ROAS will show
Was this article helpful?