How to Analyze Your Audience Demographics
In this article:
Audience Demographics
Meta has deprecated Facebook Audience data by Age and Gender. If your account was connected before 14 March 2024, you can still access insights. Accounts connected after this date will not have access to age and gender data due to API restrictions.
Demographics data is currently available for Facebook and Instagram only.
• Audience demographics are shown only if your Facebook page has more than 100 fans.
• Data starts accumulating from the day your Facebook page is connected.
• Historical demographic data is unavailable due to API restrictions.
• LinkedIn demographics are not supported.
• The Audience tab currently supports Facebook and Instagram only.
Accessing Audience Demographics:

Select a date range to analyze. The default range is the past 30 days, and predefined ranges are also available.
Overview of Audience Demographics:
The demographics tab shows your top audience by gender and age, as well as your top location.
• Displays the breakdown of fans by age group for the selected period.
• Loading bars represent different age ranges.
• Total fan count for each age group is shown next to the range.
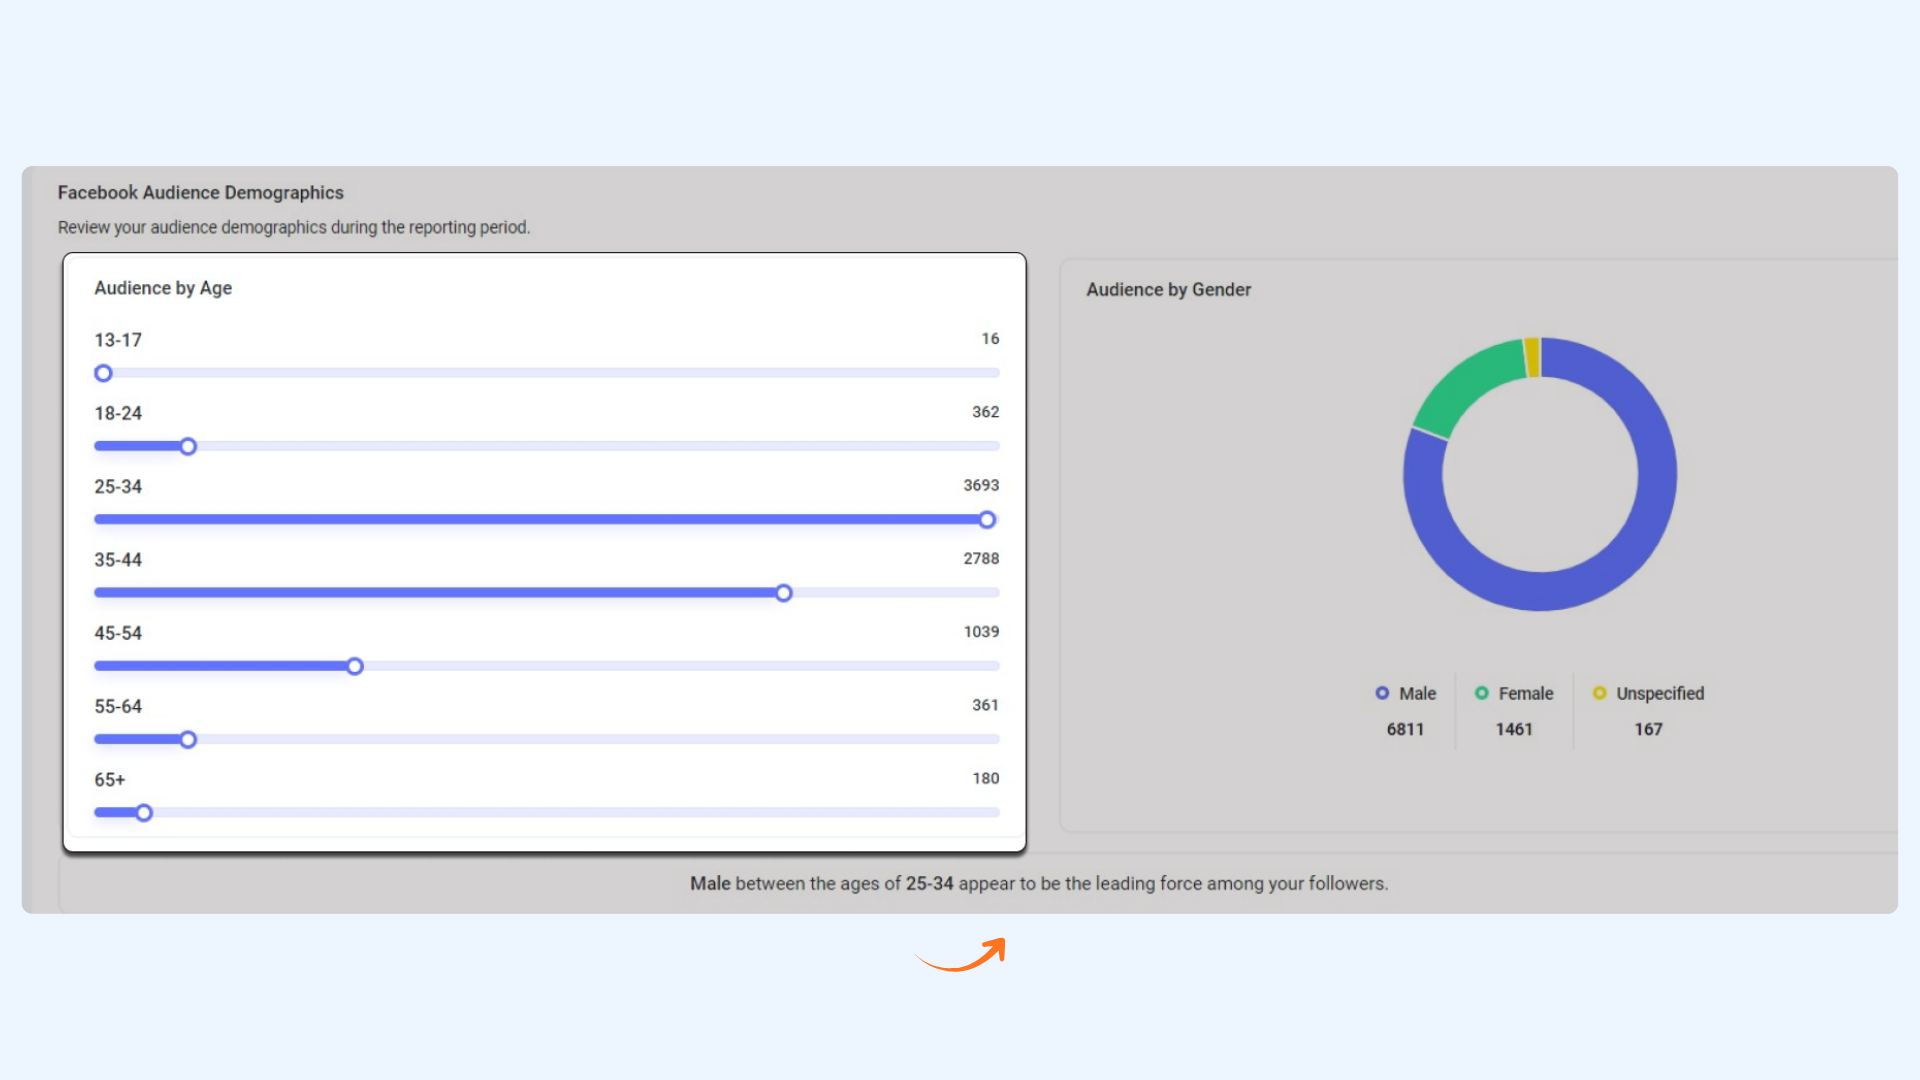
The pie chart includes:
• Purple – Male
• Green – Female
• Yellow – Unspecified
Hover over a segment to view percentage distribution.
The total count of each gender is displayed below the chart.
Click on a gender label to hide or focus on specific segments.
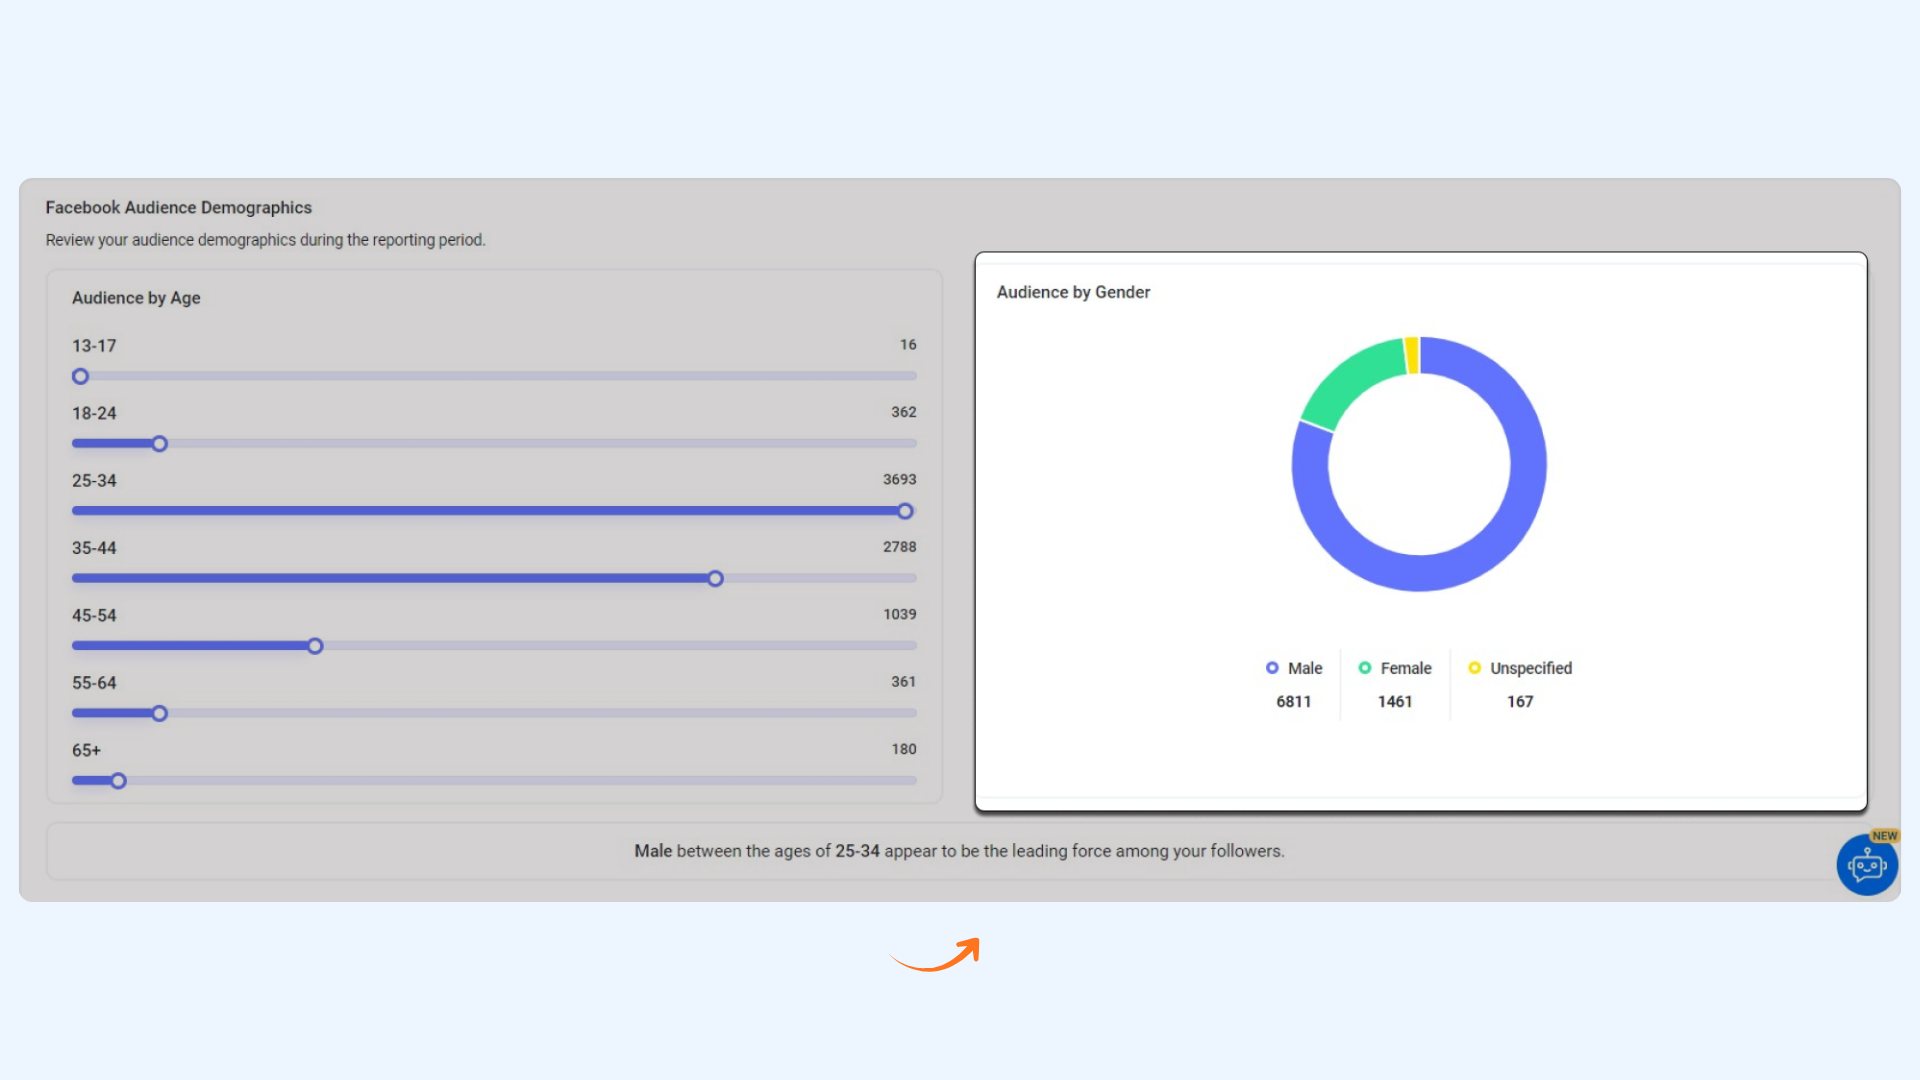
Displays the dominant combination of age group and gender based on the highest audience values.
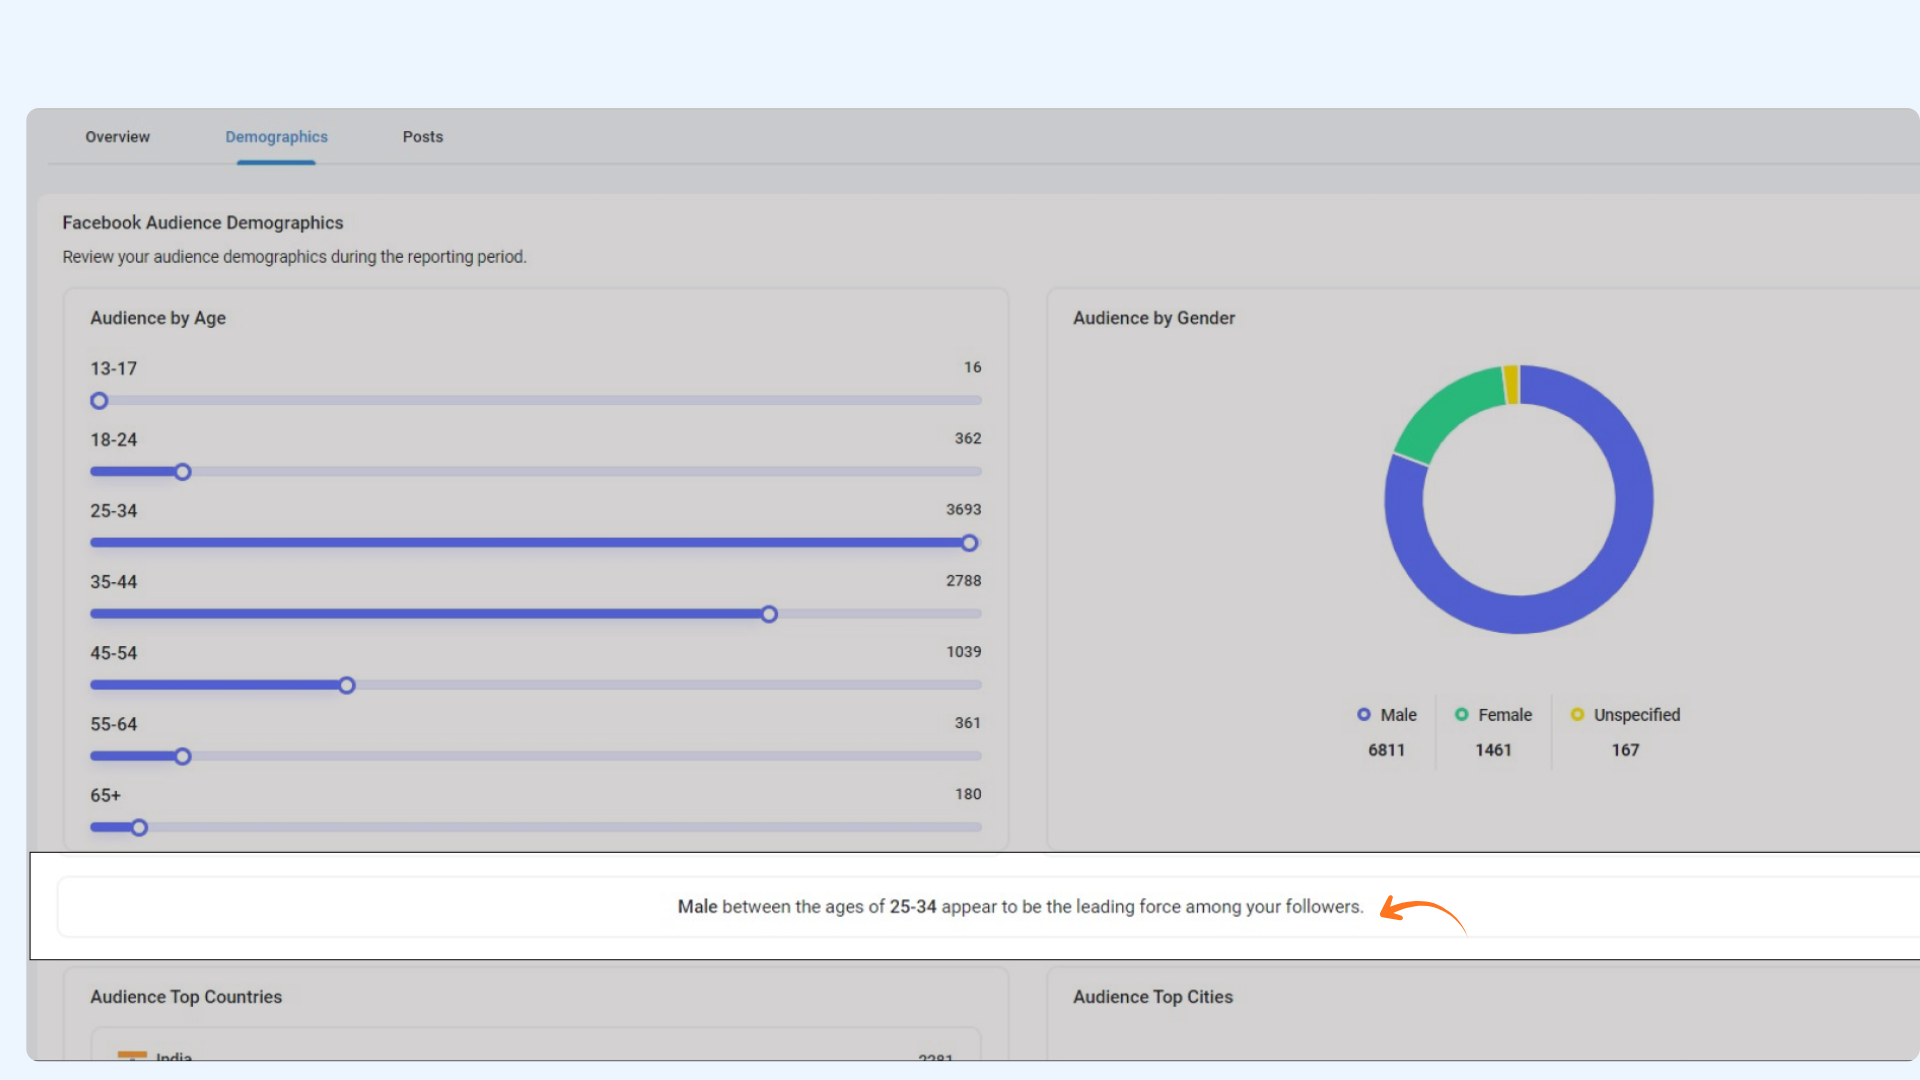
Audience by Top Countries & Cities
Shows the Top 10 countries where your fans are located, along with total fan counts for each country.
Top Cities
Shows the Top 10 cities where your fans are located, along with total fan counts for each city.
FAQs
1. Why can’t I see Age and Gender data for my Facebook page?
Meta has deprecated access to Facebook Audience data by age and gender for newly connected accounts.
If your Facebook page was connected after 14 March 2024, this data will not be available.
2. Why is no demographic data showing for my page?
Audience demographics will only appear if your Facebook page has more than 100 fans. Pages with fewer than 100 fans will not display demographic insights.
3. Does demographic data include historical insights?
No. Demographics data starts accumulating from the day your Facebook page is connected. Past historical demographic data is not available due to API restrictions.
4. Can I view demographics for LinkedIn?
No. Demographics insights for LinkedIn are currently not supported. The Audience tab only shows data for Facebook and Instagram.
5. Can I view demographics for multiple accounts?
Yes. If you manage multiple accounts under the same social network (e.g., multiple Facebook pages), you can switch between them using the account dropdown at the top of the dashboard.
6. Can I change the date range for analysis?
Yes. You can select a custom date range. The default view shows the past 30 days, and predefined ranges are also available for quick selection.