Google Business Profile Analytics
The Google Business Profile (GBP) Analytics 📈 module gives you a powerful, at-a-glance view of how your business is performing on Google Search and Maps. From tracking how customers discover your listing to monitoring calls, website visits, and direction requests, GBP Analytics helps you understand the real-world impact of your online presence. With clear metrics and trend data, you can make informed, data-driven decisions to strengthen your local visibility and drive more customer interactions.
In this article:
- Accessing GBP Analytics
- Analytics Dashboard
- Overview Tab
- Posts Tab
- AI Insights
- Saving and Exporting Your GBP Data
- FAQs
- Upon connecting your Google Business Profile, ContentStudio begins gathering metrics that are displayed after a single data sync.
- Data is displayed according to your workspace's time zone.
- Data processing runs every 24 hours to ensure your metrics are kept up to date.
Accessing GBP Analytics
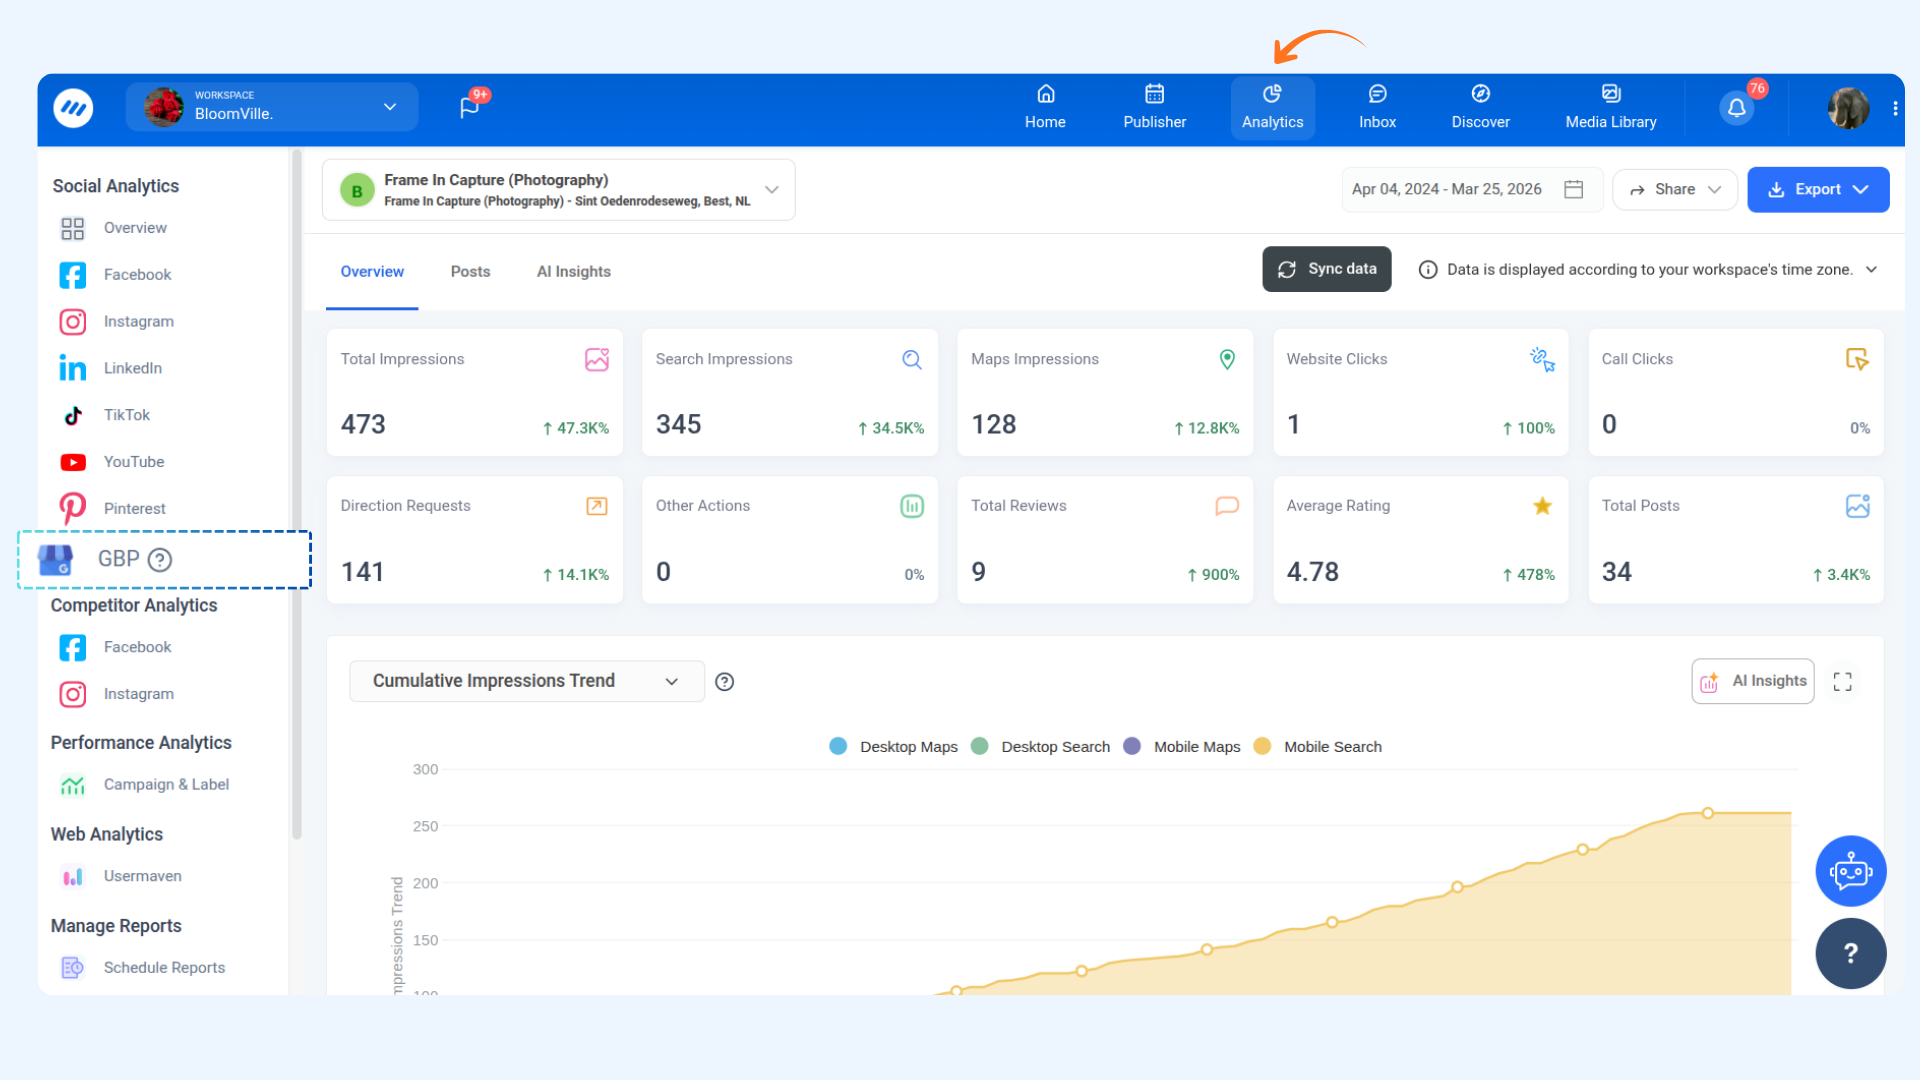
Analytics Dashboard
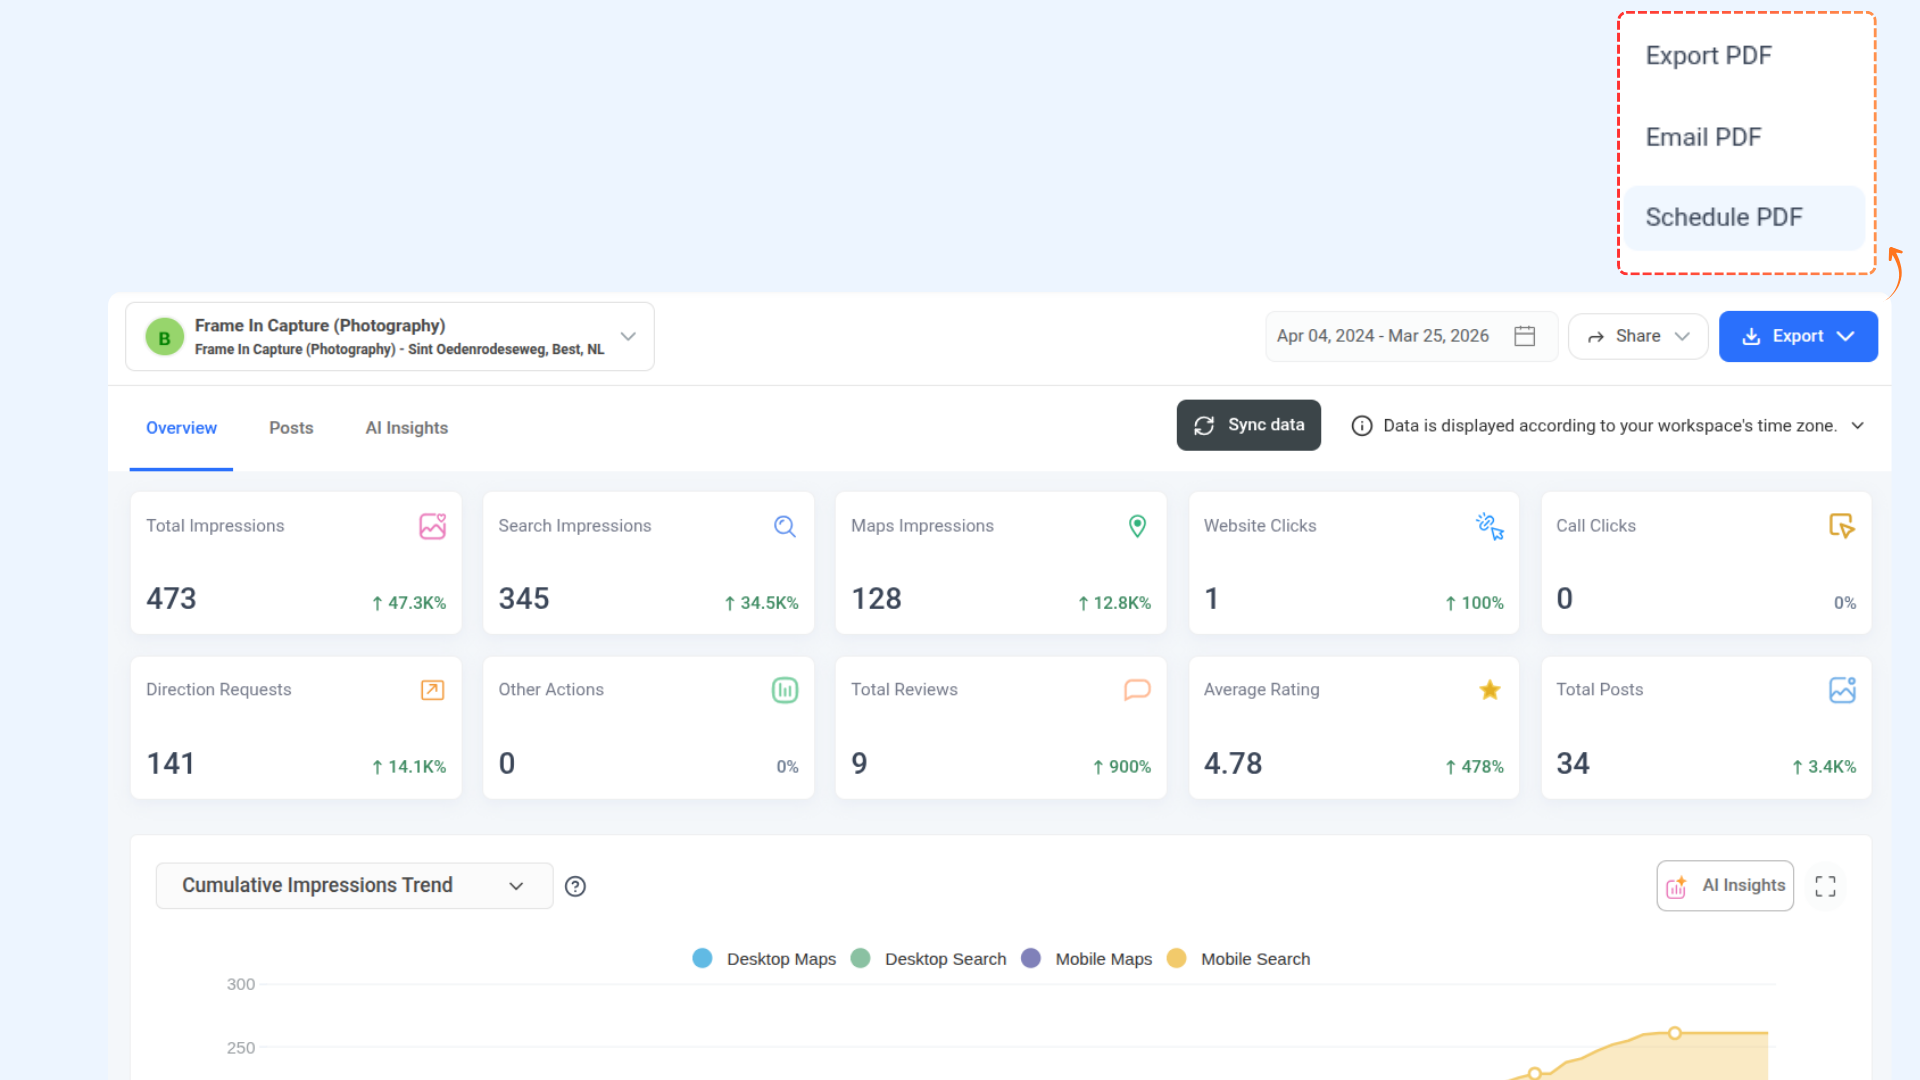
The Overview tab provides a high-level snapshot of your Google Business Profile's performance, including how customers are finding and interacting with your listing.
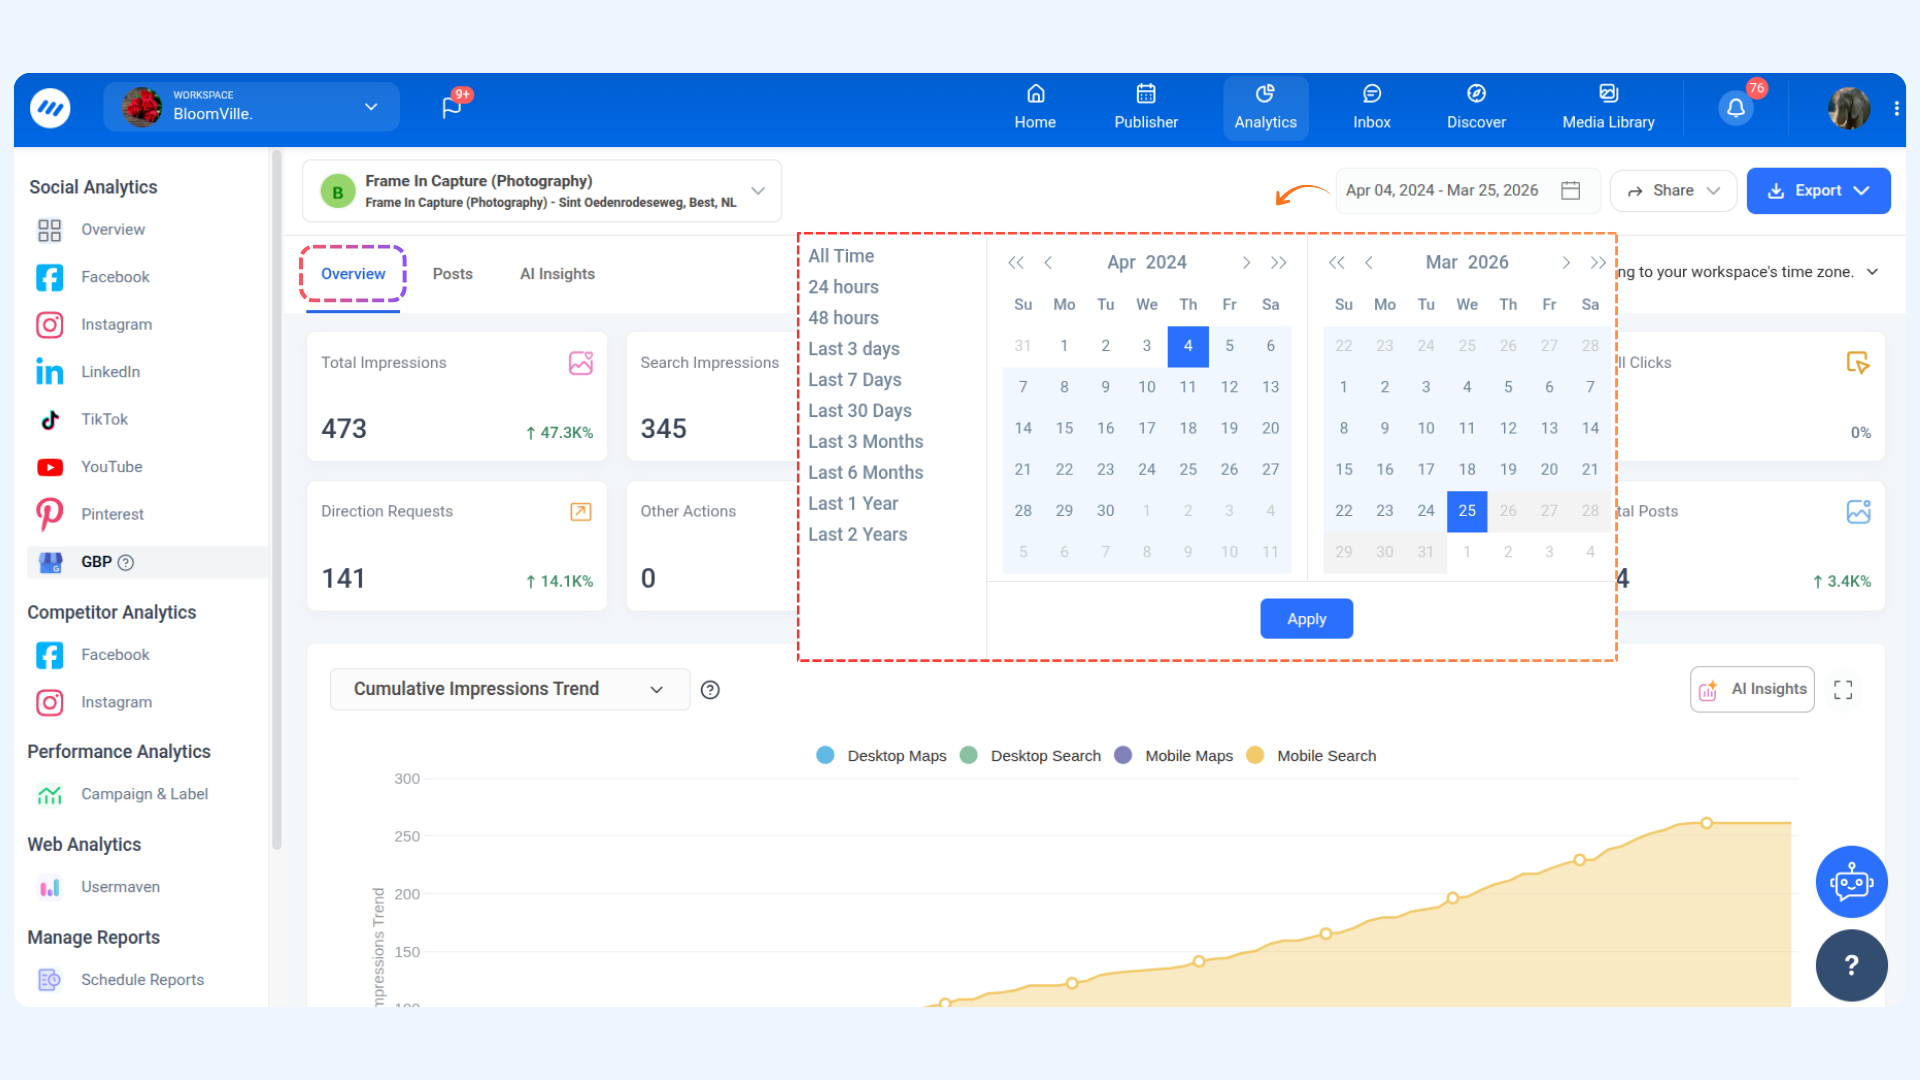
- Your connected GBP location is shown by default. If you manage multiple locations, you can switch between them using the dropdown at the top.
- Select a date range to analyze your metrics. The default view covers the past 30 days.
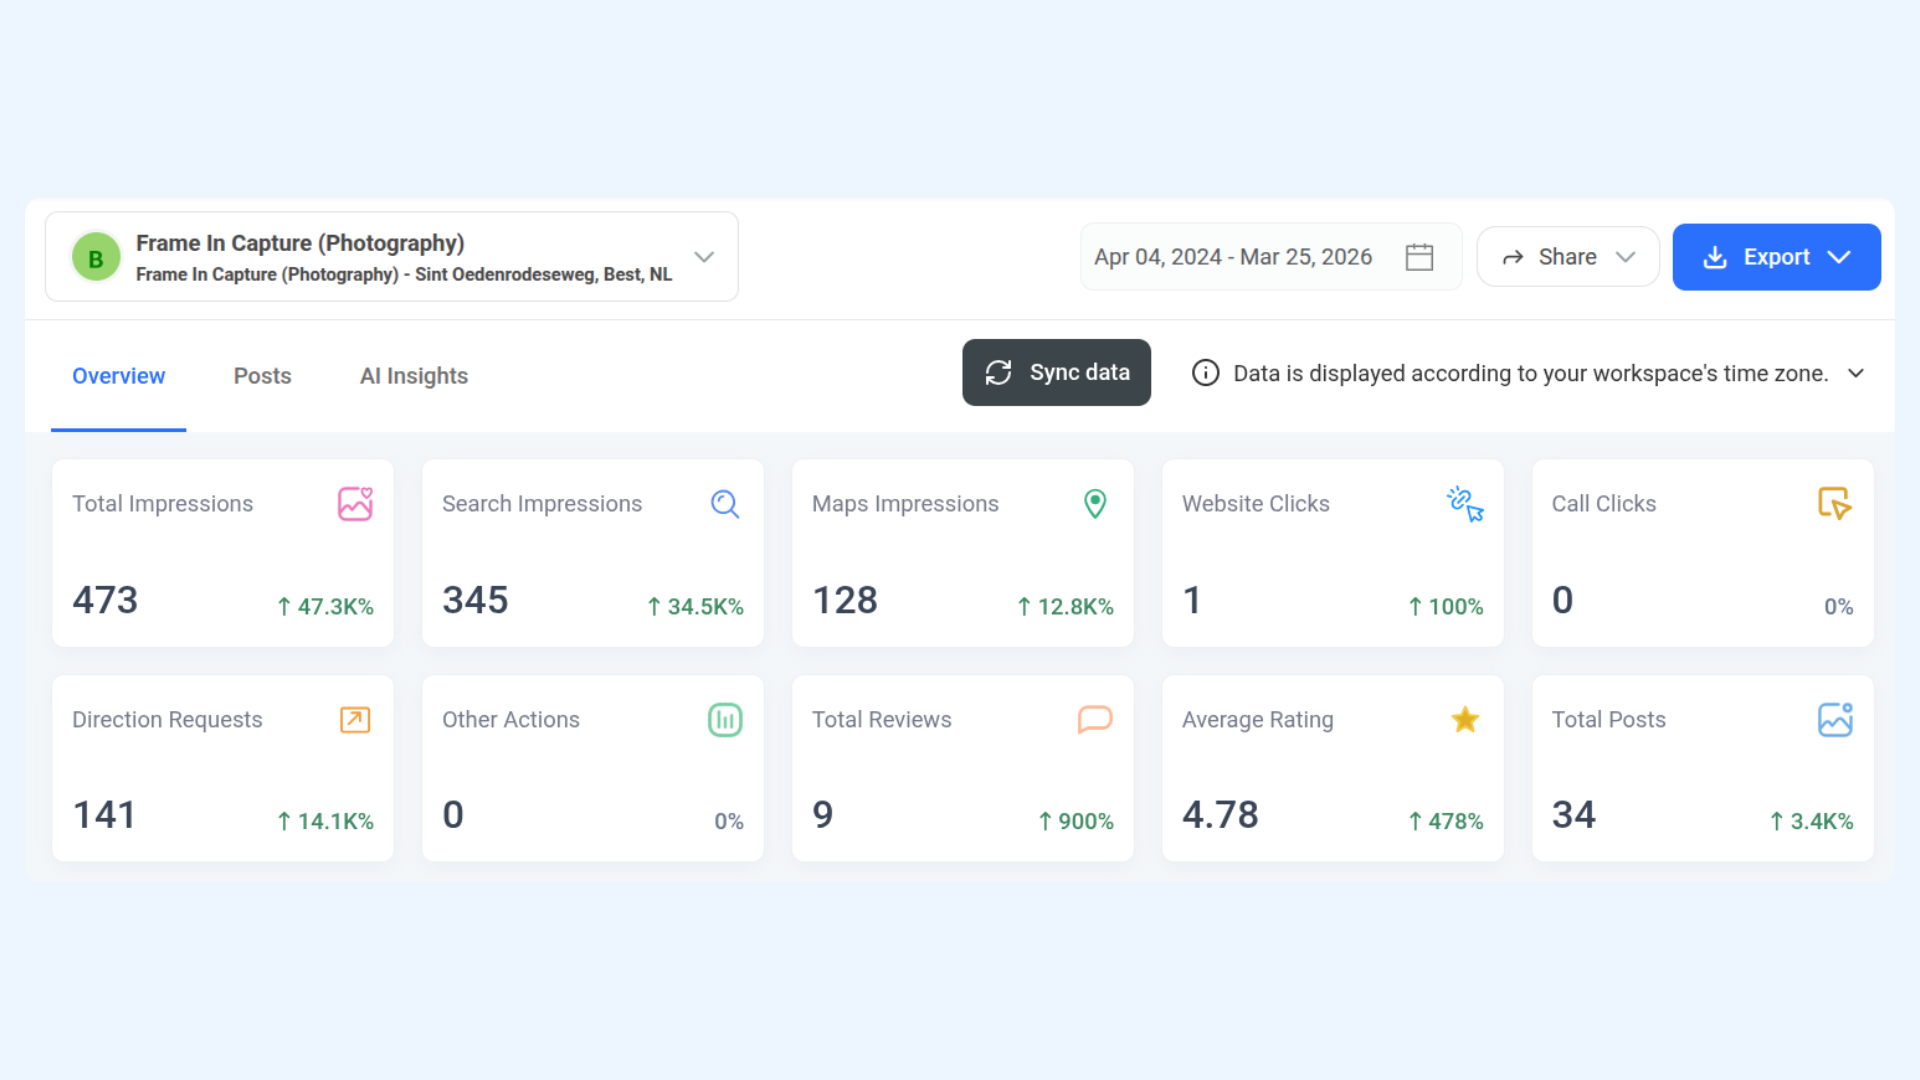
The Overview section features a set of metric cards, each providing a quick summary of a key performance indicator for your GBP location. Each card displays:
- Total count for the selected period
- Percentage rate of change compared to the previous period of the same length (shown with an up or down arrow)
Here is a breakdown of each metric card:
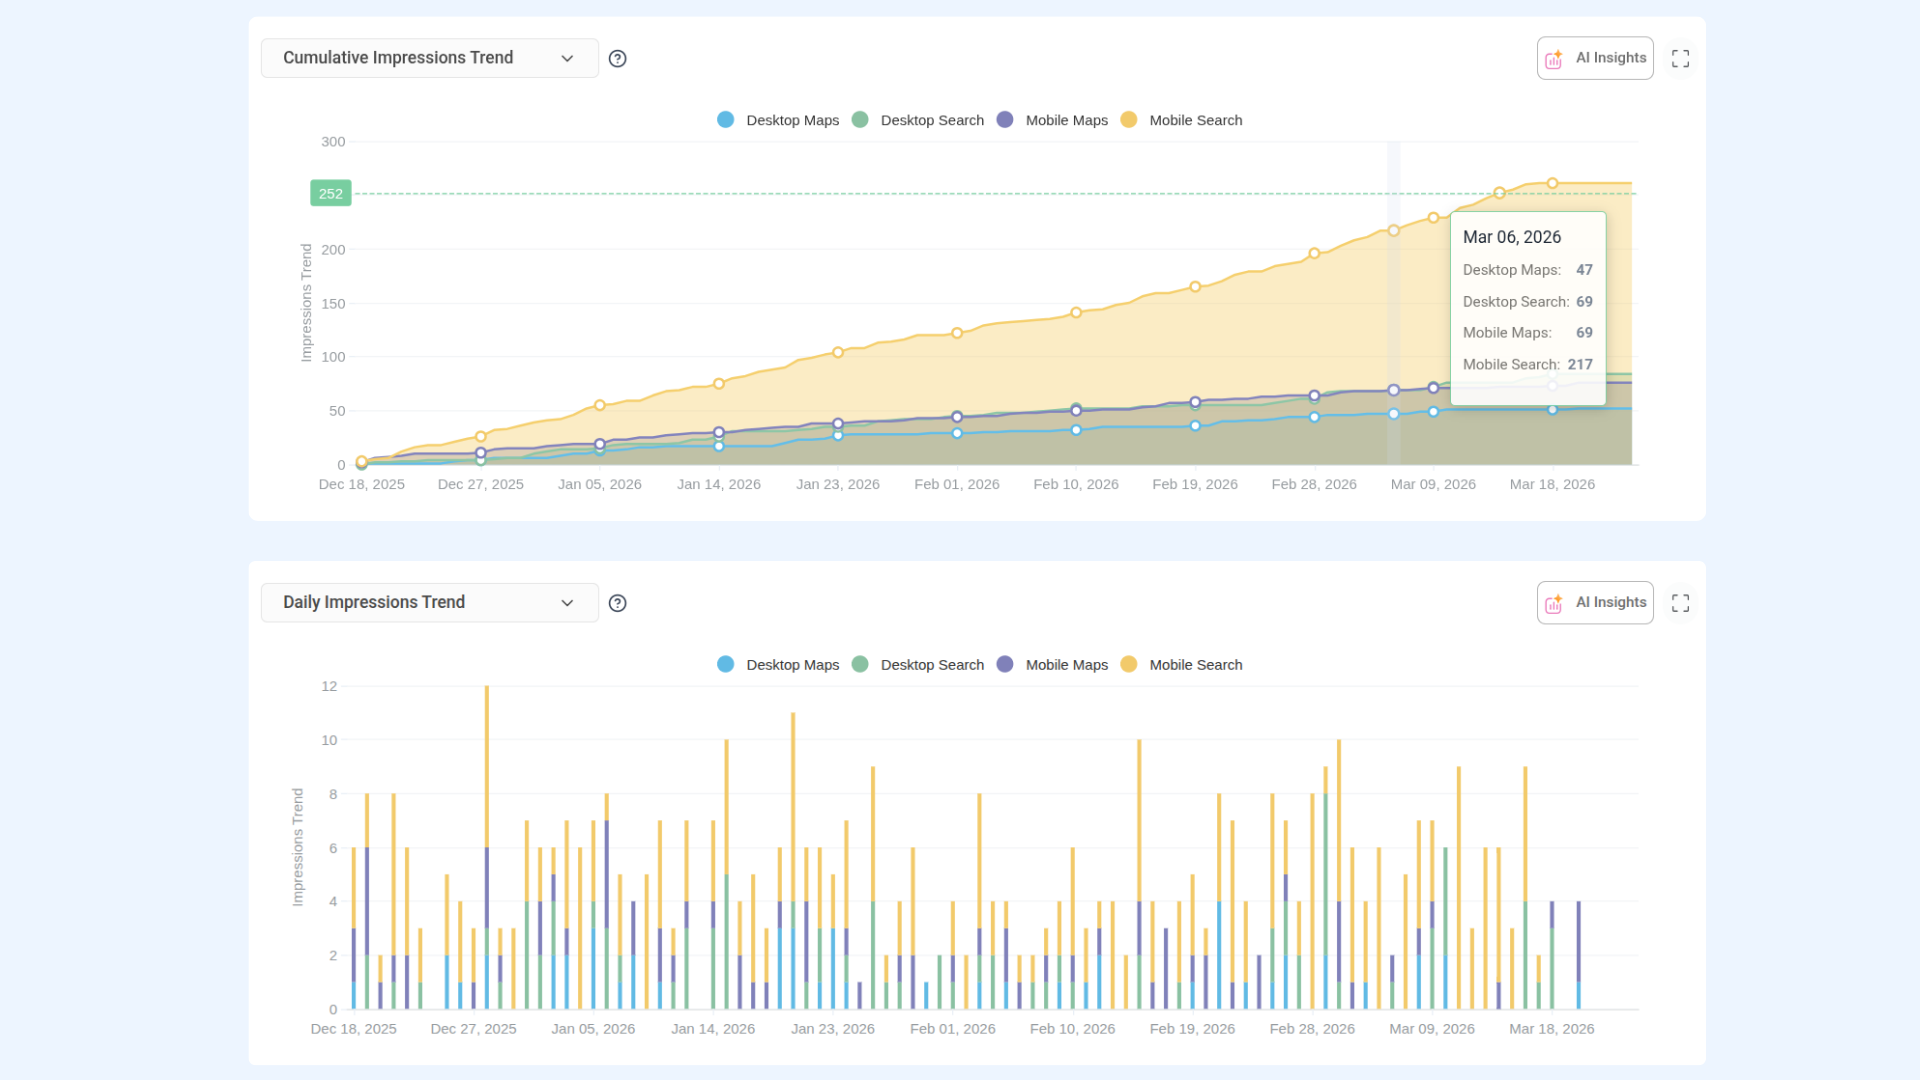
The Cumulative Impressions Trend chart visualizes how your total impressions have built up over the selected time period. You can switch the chart view using the dropdown:
- Cumulative Impressions Trend – Shows the running total of all impressions accumulated day by day across the selected date range.
- Daily Impressions Trend – Shows the number of impressions recorded on each individual day, helping you identify peak visibility days and dips.
The X-axis maps the selected time period, while the Y-axis tracks the impression count. Hover over any data point to see the exact value for that day.
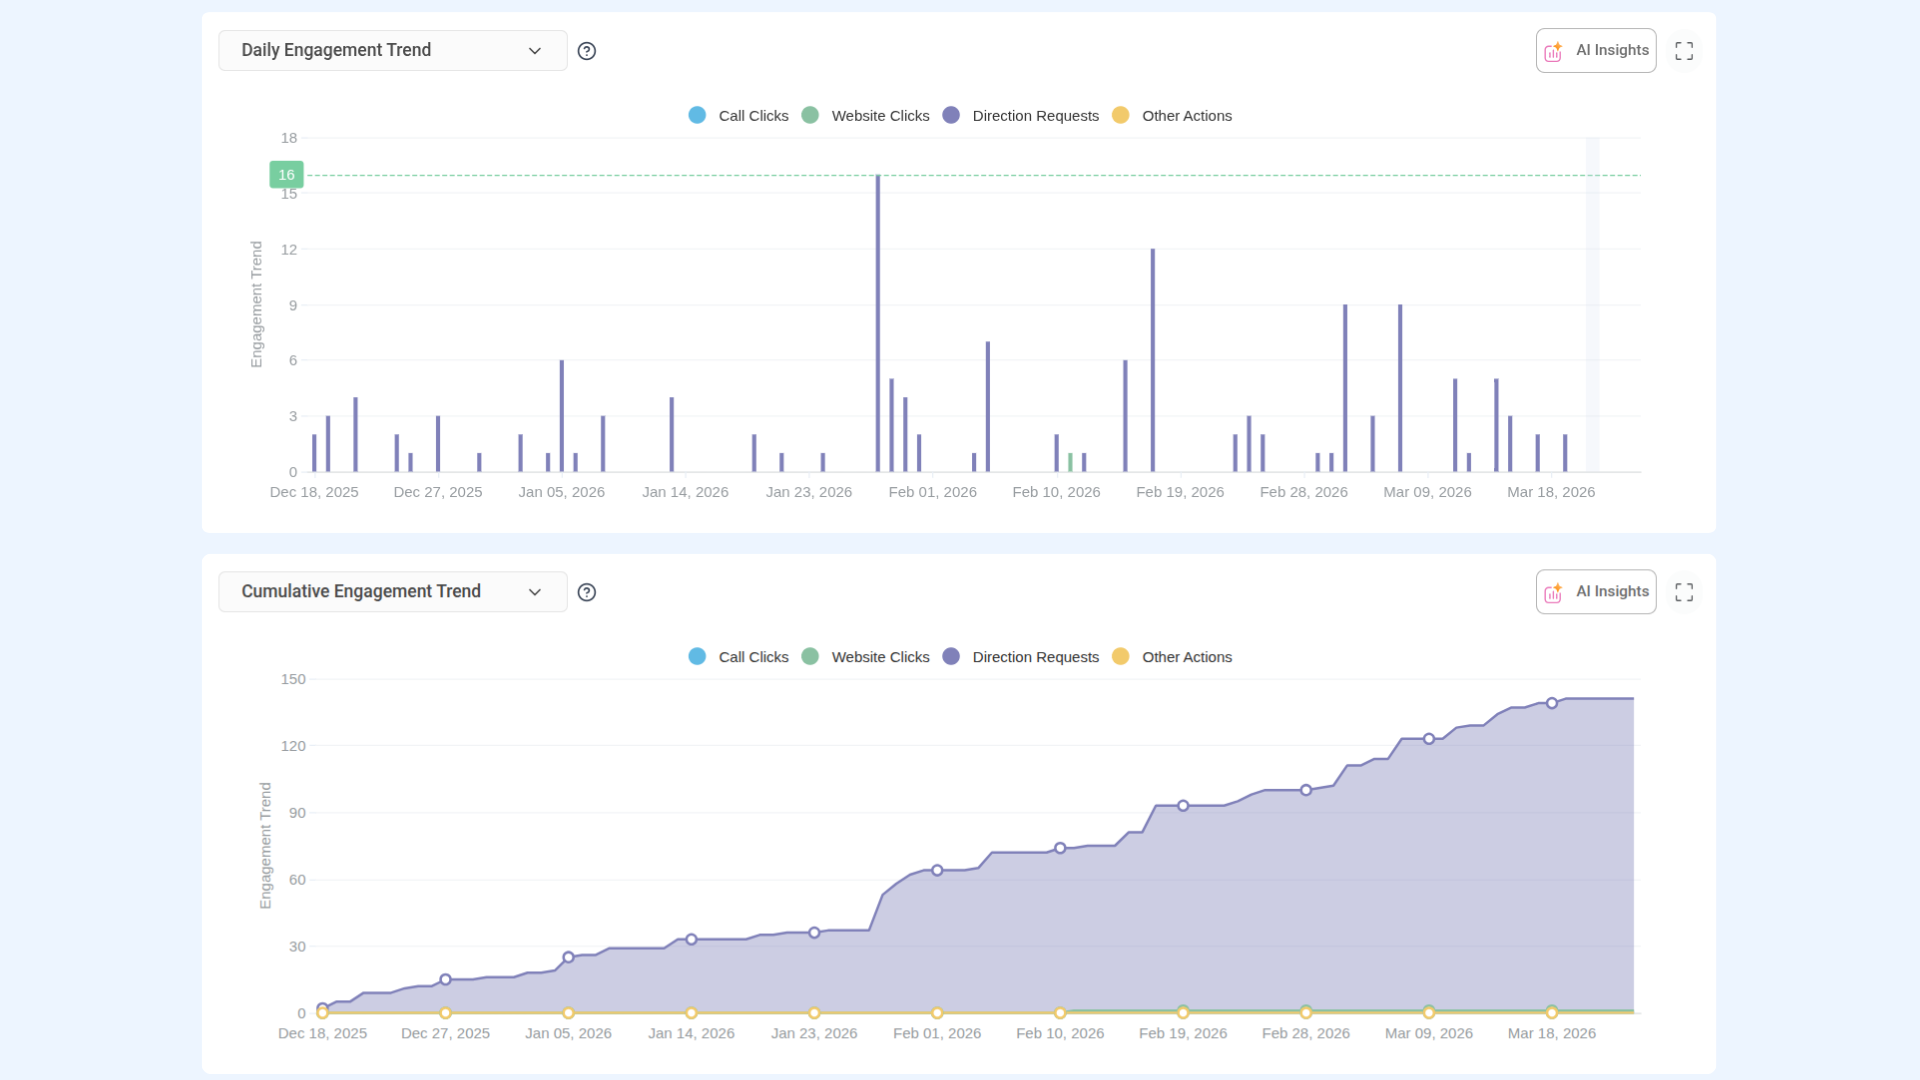
The Cumulative Engagement Trend chart tracks how customer interactions with your GBP listing have grown over the selected period. Use the dropdown to toggle between views:
- Cumulative Engagement Trend – Displays the running total of all engagement actions (website clicks, call clicks, direction requests, and other actions) accumulated across the selected date range.
- Daily Engagement Trend – Shows the engagement actions recorded on each individual day, making it easier to spot high-activity days and trends.
The X-axis maps the selected time period, while the Y-axis tracks the engagement count.
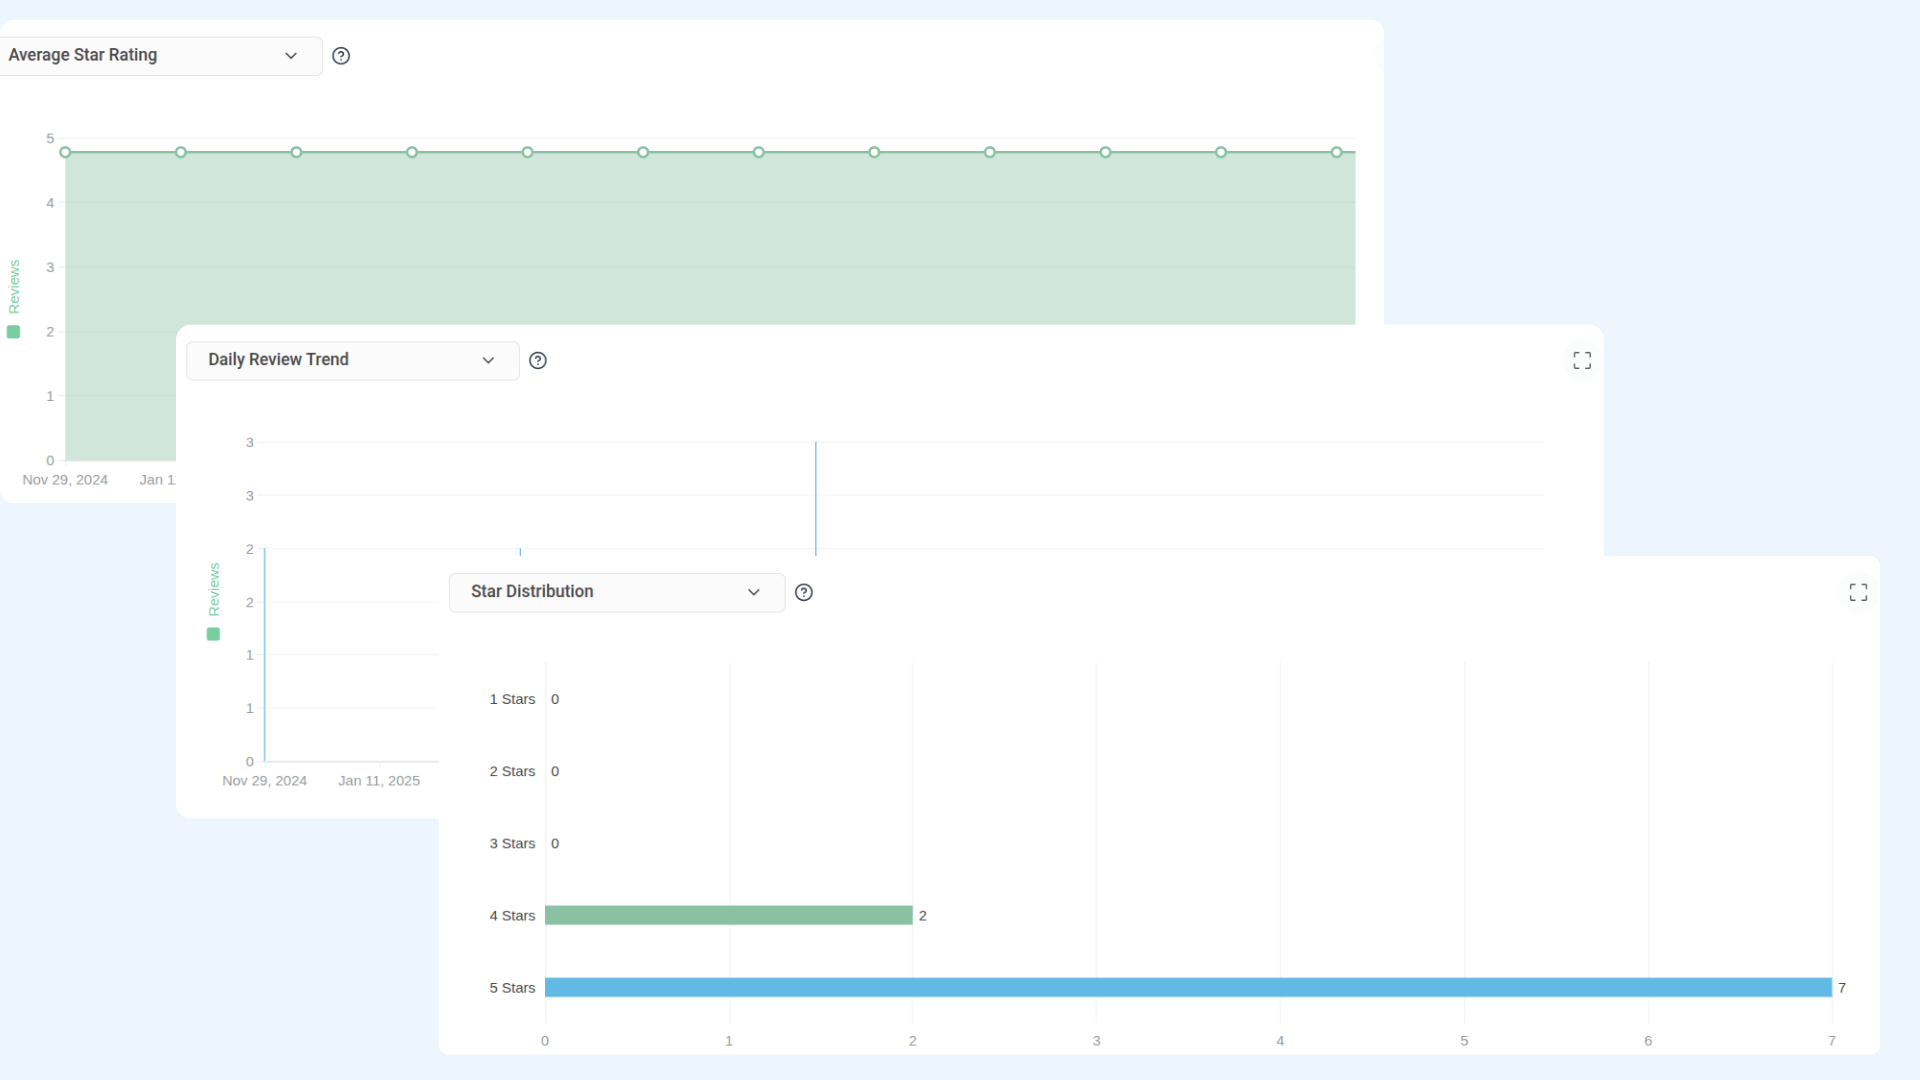
The Average Star Rating section gives you a visual breakdown of how customers are rating your business. Use the dropdown to switch between views:
- Average Star Rating – Displays the overall average star rating of your GBP location across the selected time period, helping you monitor shifts in customer sentiment.
- Star Distribution – Shows a breakdown of how many reviews fall into each star category (1 through 5), giving you a clear picture of your rating composition.
- Daily Review Trend – Tracks the number of reviews received each day during the selected period, helping you identify spikes in review activity.
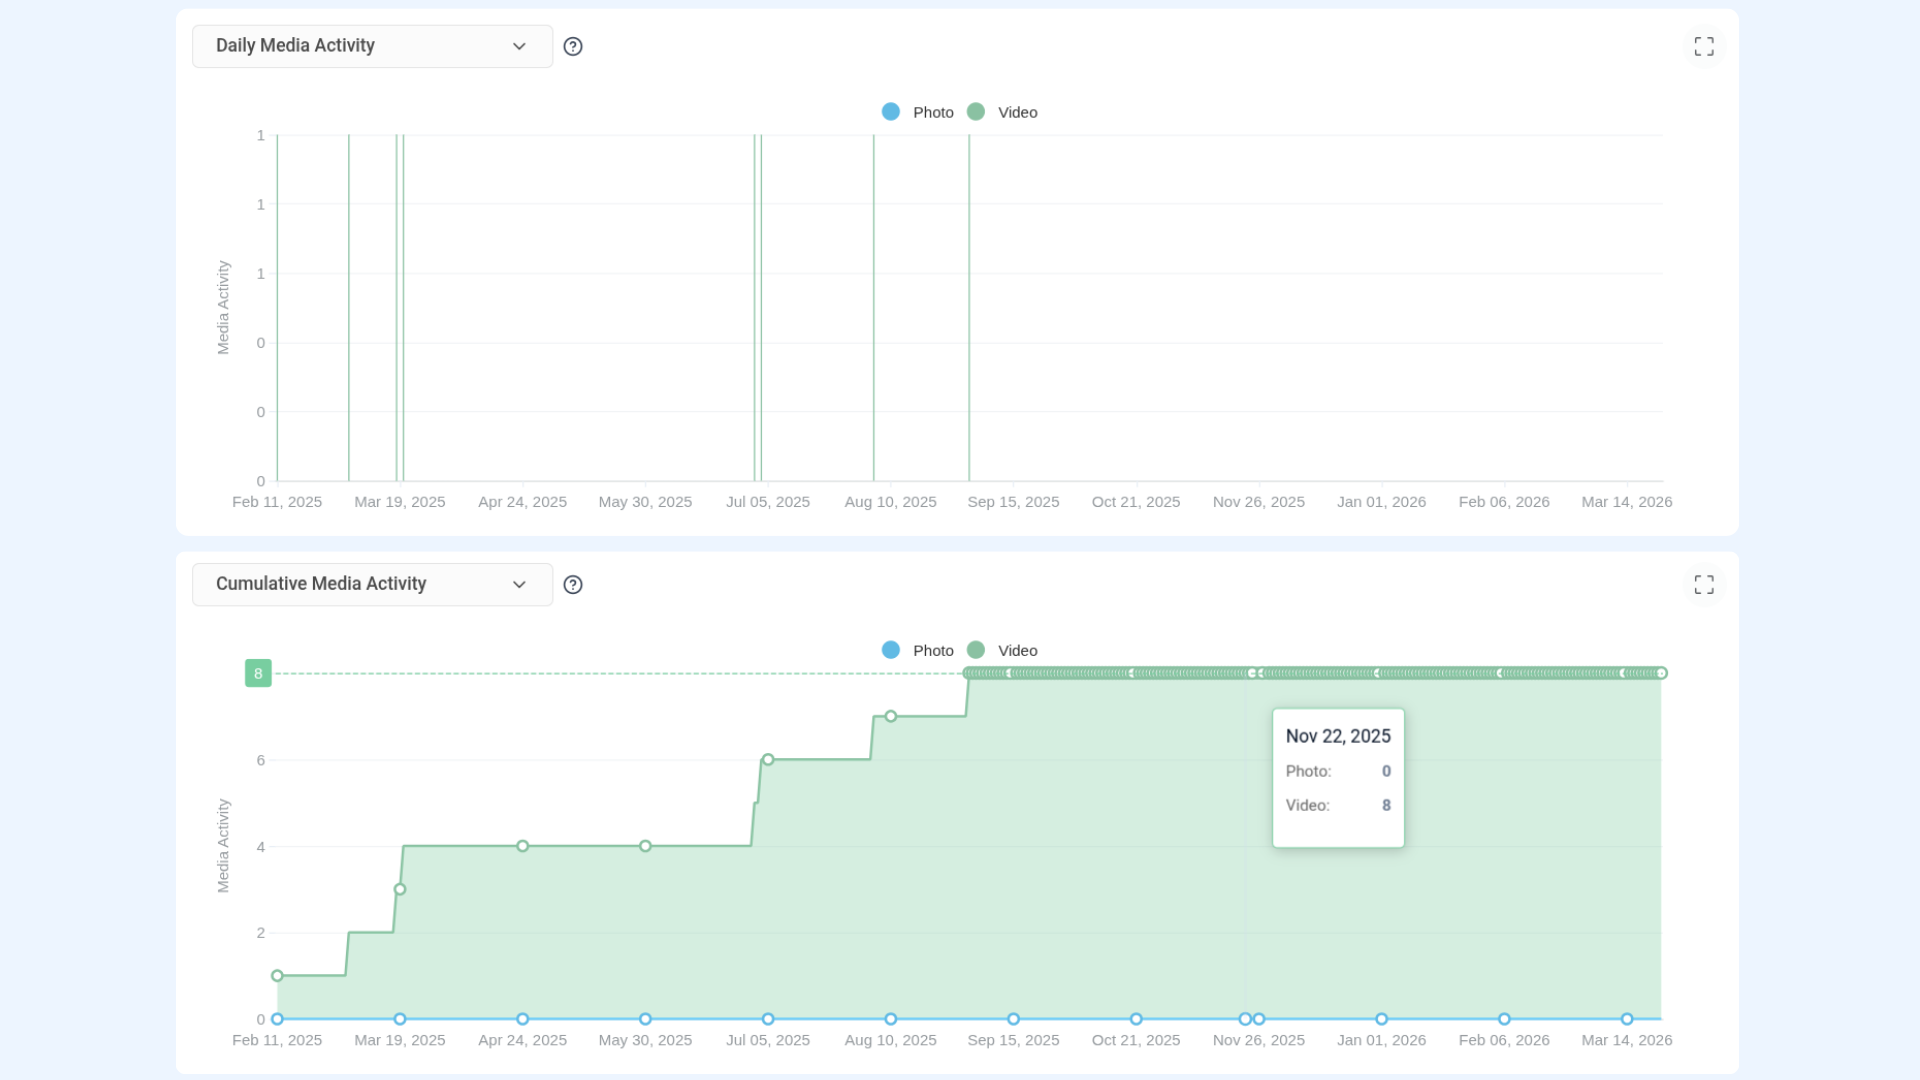
The Cumulative Media Activity chart tracks how photos and videos associated with your GBP listing have accumulated over time. Use the dropdown to toggle between:
- Cumulative Media Activity – Displays the running total of photos and videos uploaded to your listing across the selected date range. The chart distinguishes between Photo (blue) and Video (green) activity.
- Daily Media Activity – Shows media uploads on a per-day basis, helping you track consistency and identify when new media was added.
The X-axis maps the date, while the Y-axis reflects the media activity count. Hover over data points to see exact values for photos and videos separately.
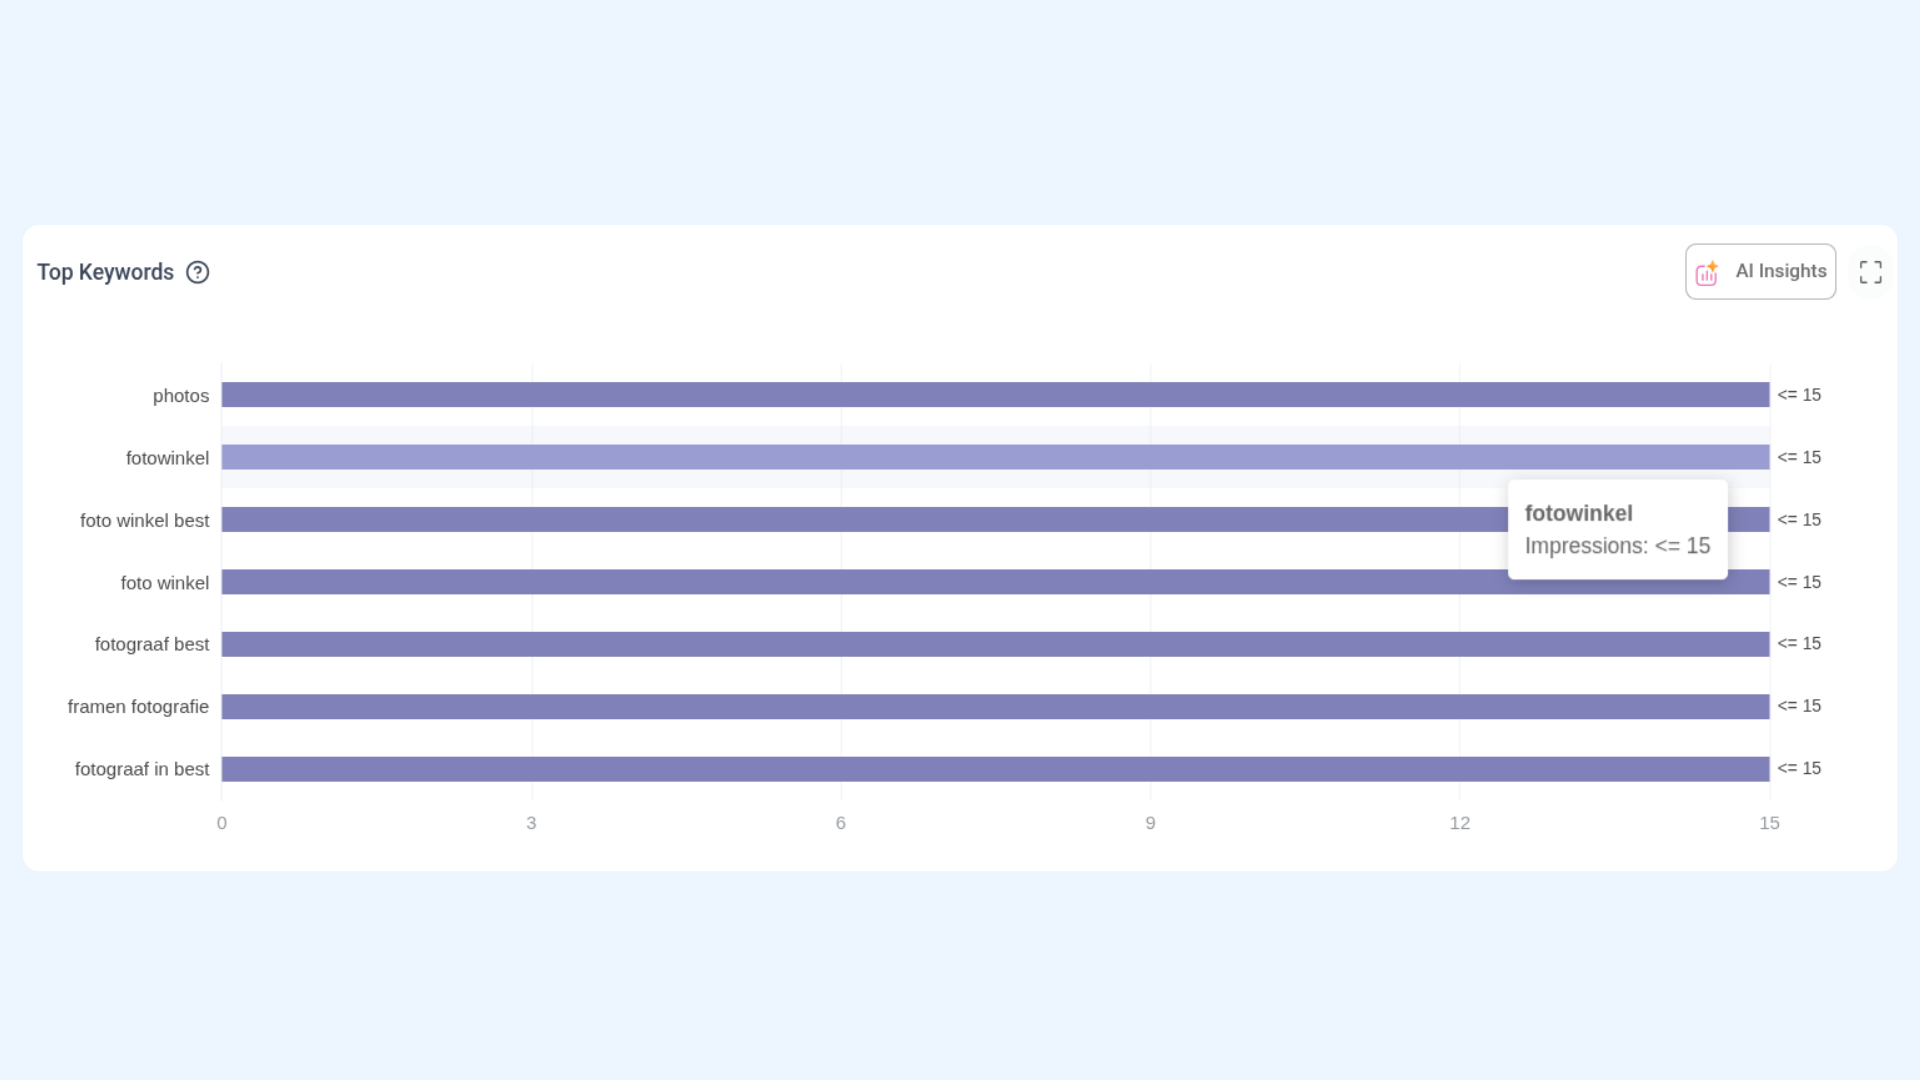
The Top Keywords section reveals the search terms customers most commonly used to find your GBP listing during the selected period. This data is sourced from Google and helps you understand what queries are driving visibility for your business.
Use these insights to align your business description, posts, and website content with the terms your customers are already using to find you.
The Recent Posts section displays the most recently published posts on your Google Business Profile during the selected time period. This gives you a quick overview of your recent content activity directly from the analytics dashboard.
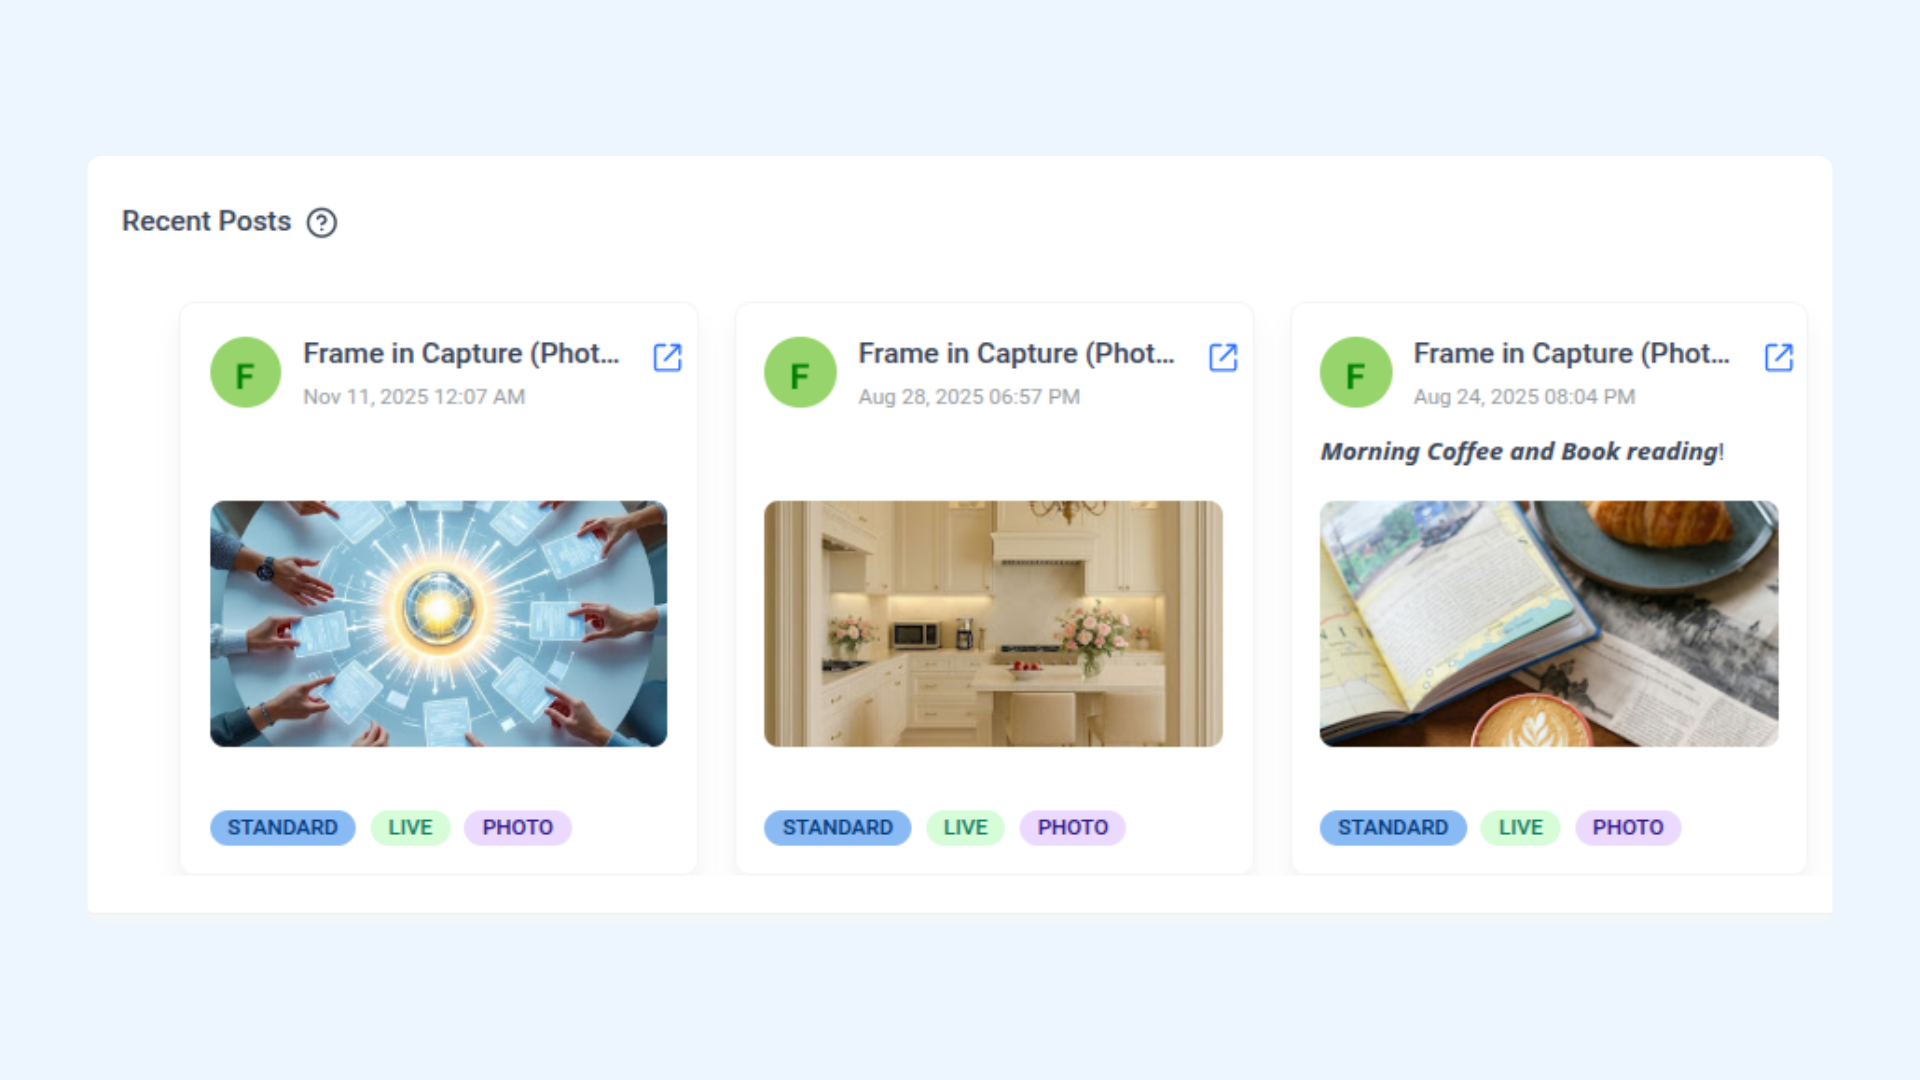
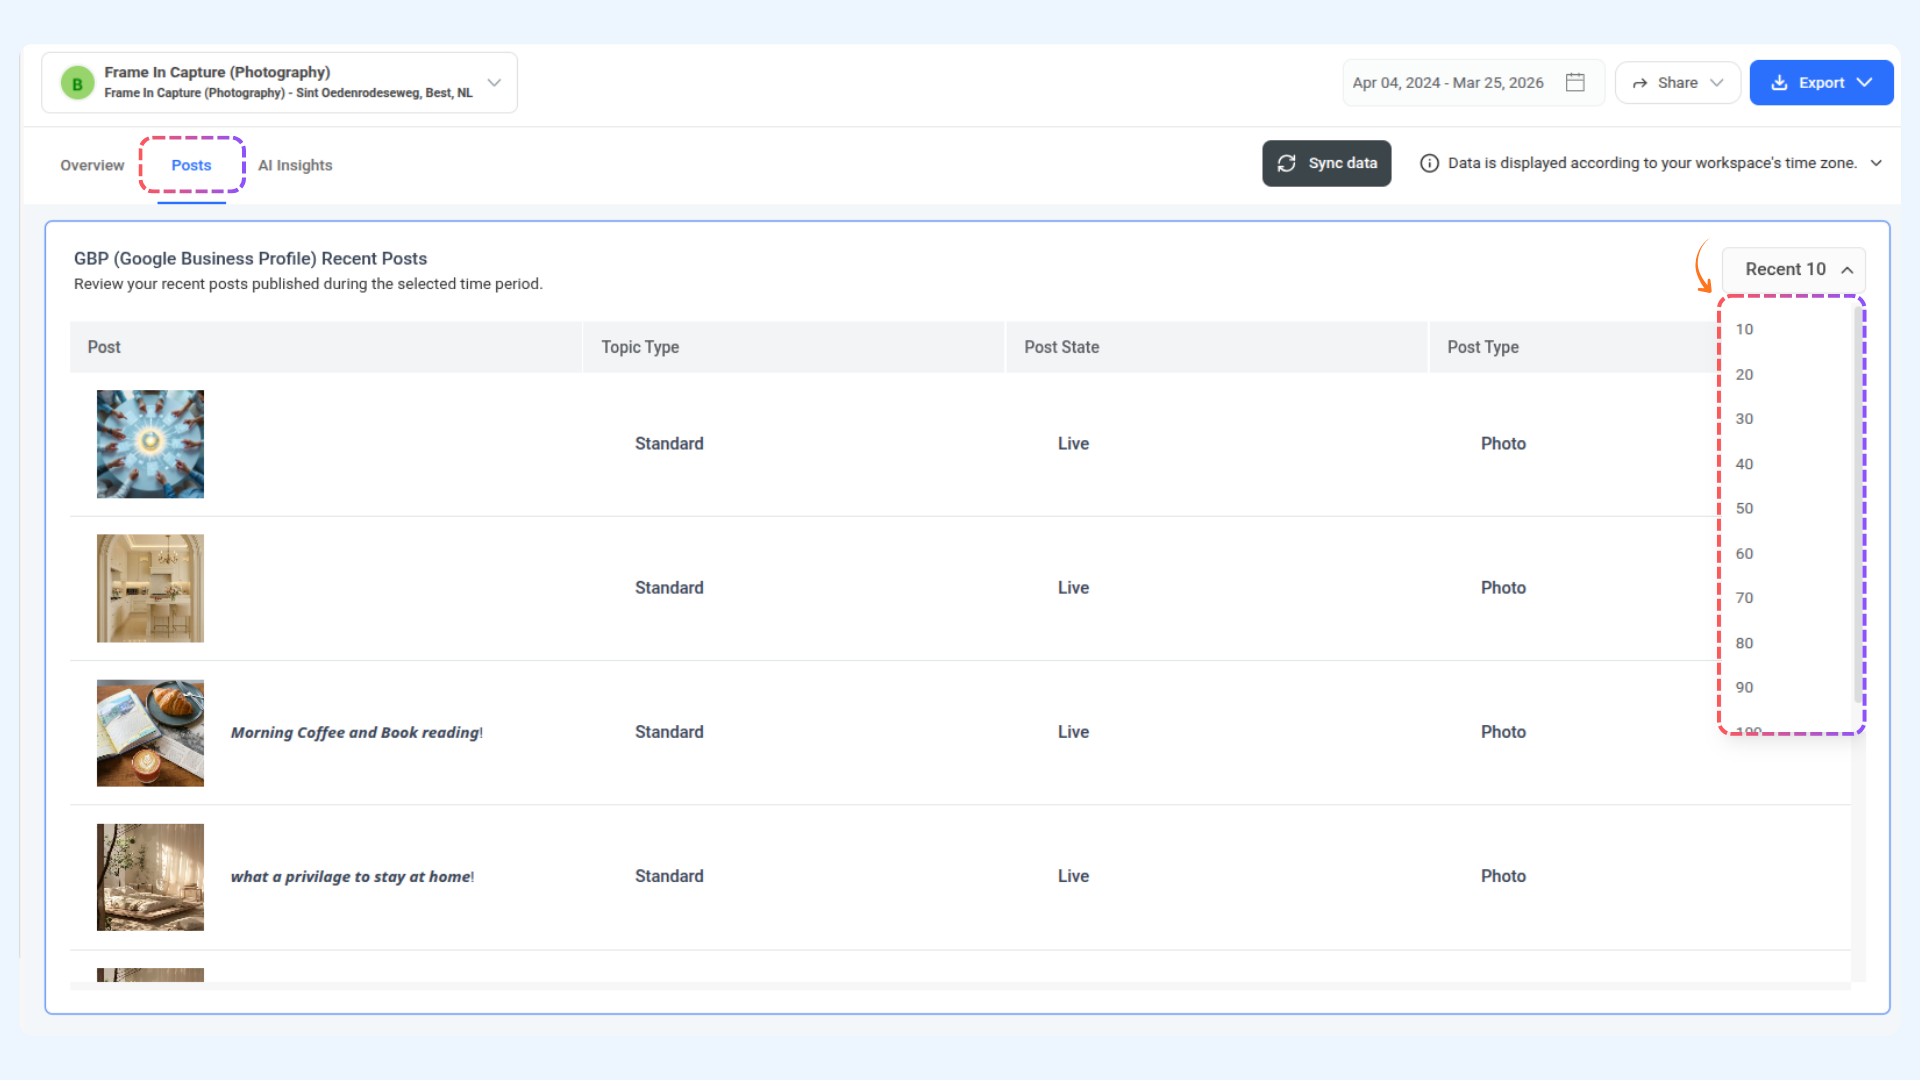
The Posts tab provides a detailed view of all content published on your GBP location. Review your recent posts published during the selected time period.
For each post listed, the following details are shown:
- Post – A thumbnail preview of the post along with its caption.
- Topic Type – The topic category of the post (e.g., Standard).
- Post State – The current status of the post (e.g., Live).
- Post Type – The media format of the post (e.g., Photo).
Use the Recent dropdown in the top-right corner of the section to control how many posts are displayed at once — options range from 10 up to 100.
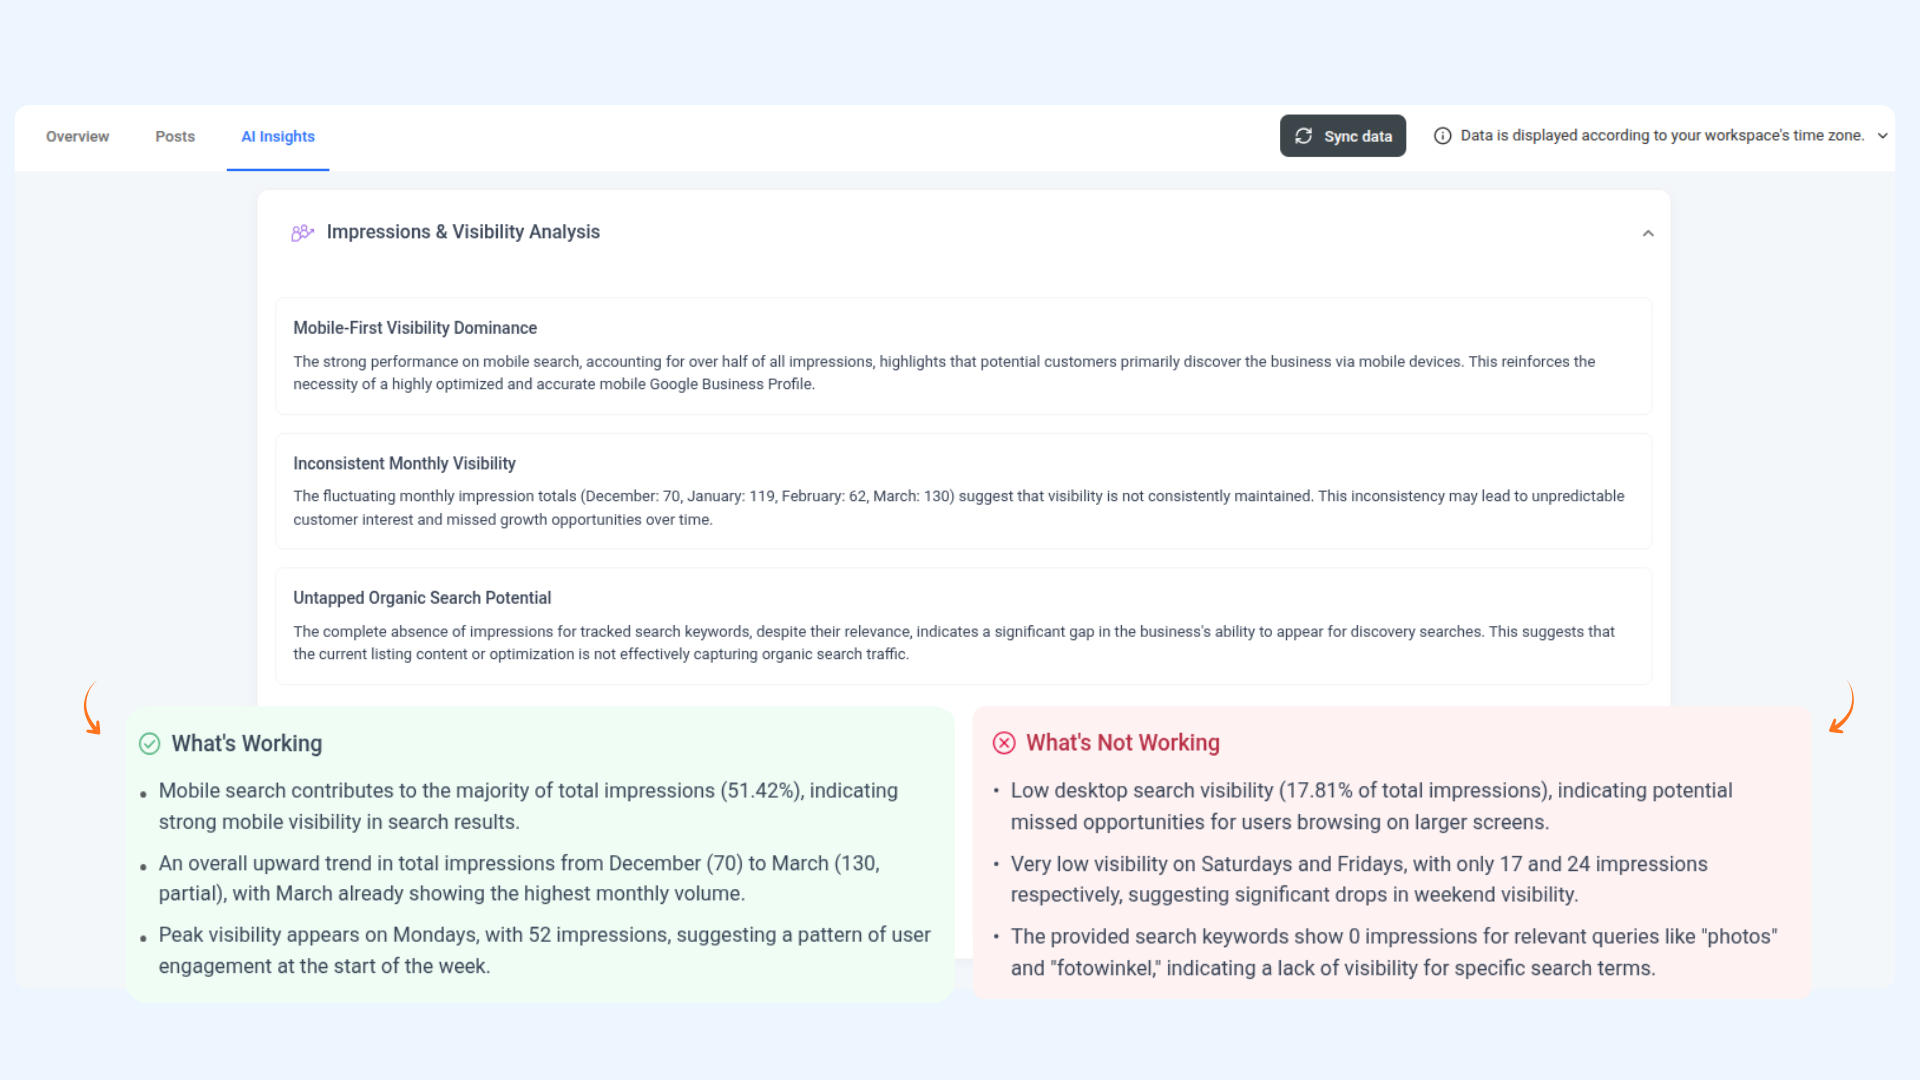
Throughout the GBP Analytics dashboard, you'll notice an AI Insights button on most charts and sections. Clicking this will generate an AI-powered analysis of that particular metric or trend, offering actionable recommendations to help you improve performance.
Use AI Insights to:
- Quickly interpret what a trend means for your business.
- Get suggestions on improving visibility, engagement, or review ratings.
- Understand your data without needing to be an analytics expert.
The Export button in the top-right corner of the analytics dashboard lets you extract and save your GBP analytics data for reporting or further analysis.
You can export your data in the following ways:
You can also use the Share button to generate a shareable link to your analytics dashboard for stakeholders or clients.
FAQs
Q1. How often is the GBP Analytics data updated?
A. GBP data is processed every 24 hours, so your metrics are refreshed on a daily basis. You can also manually trigger a refresh by clicking the "Sync data" button at the top of the dashboard. Keep in mind that Google may have its own reporting delays, so some metrics may not always reflect same-day activity.
Q2. Why are all my metric cards showing 0?
A. If all cards are showing 0, it is likely that your GBP location hasn't received any impressions, clicks, or actions during the selected date range, or that Google hasn't reported the data yet. Try clicking "Sync data" to refresh. If the issue persists, verify that your GBP location is properly connected to ContentStudio.
Q3. What is the difference between Search Impressions and Maps Impressions?
A. Search Impressions count how often your listing appeared in Google Search results, while Maps Impressions count how often your listing appeared in Google Maps. Total Impressions is the combined sum of both.
Q4. What does the "Other Actions" metric include?
A. Other Actions captures additional customer interactions on your GBP listing beyond calls and website clicks. This includes business conversations (via Google messaging), booking clicks, food order clicks, and menu clicks.
Q5. Why is there no data in the Top Keywords section?
A. Top Keywords data is provided by Google and may not always be available. This can happen when the volume of searches is too low for Google to report keyword data, or when the data has not yet been processed for the selected period.
Q6. Can I view analytics for multiple GBP locations?
A. Yes. If you have multiple GBP locations connected to ContentStudio, you can switch between them using the location dropdown at the top of the dashboard. Each location's data is tracked independently.
Q7. What does Average Rating show, and how is it calculated?
A. The Average Rating card shows the mean star rating of all reviews received on your GBP listing during the selected time period. It is calculated by dividing the total star value of all reviews by the number of reviews received in that period.
Q8. Can I export GBP Analytics data for client reporting?
A. Yes. Use the Export button to download your analytics as a PDF, send it directly via email, or schedule automated PDF reports. The Share button also allows you to generate a shareable dashboard link for clients.
Q9. Why does my Total Posts card show -100%?
A. A -100% change means that posts were published during the previous period but none were published during the currently selected period. This is simply a comparison indicator and does not indicate an error.
Q10. What time zone is used for GBP Analytics data?
A. All data in the GBP Analytics dashboard is displayed according to your workspace's time zone, as shown in the timezone notice at the top of the dashboard. Data is processed every 24 hours, so metrics reflect activity up to the most recent daily update cycle.