

Bluesky Analytics
ContentStudio now supports analytics for Bluesky, giving you a complete breakdown of how your Bluesky account is performing — all from the same Analytics dashboard you already use for your other social channels. Track your followers, engagement, posting patterns, top-performing content, hashtag usage, and more, without switching between platforms.
How to Access Bluesky Analytics
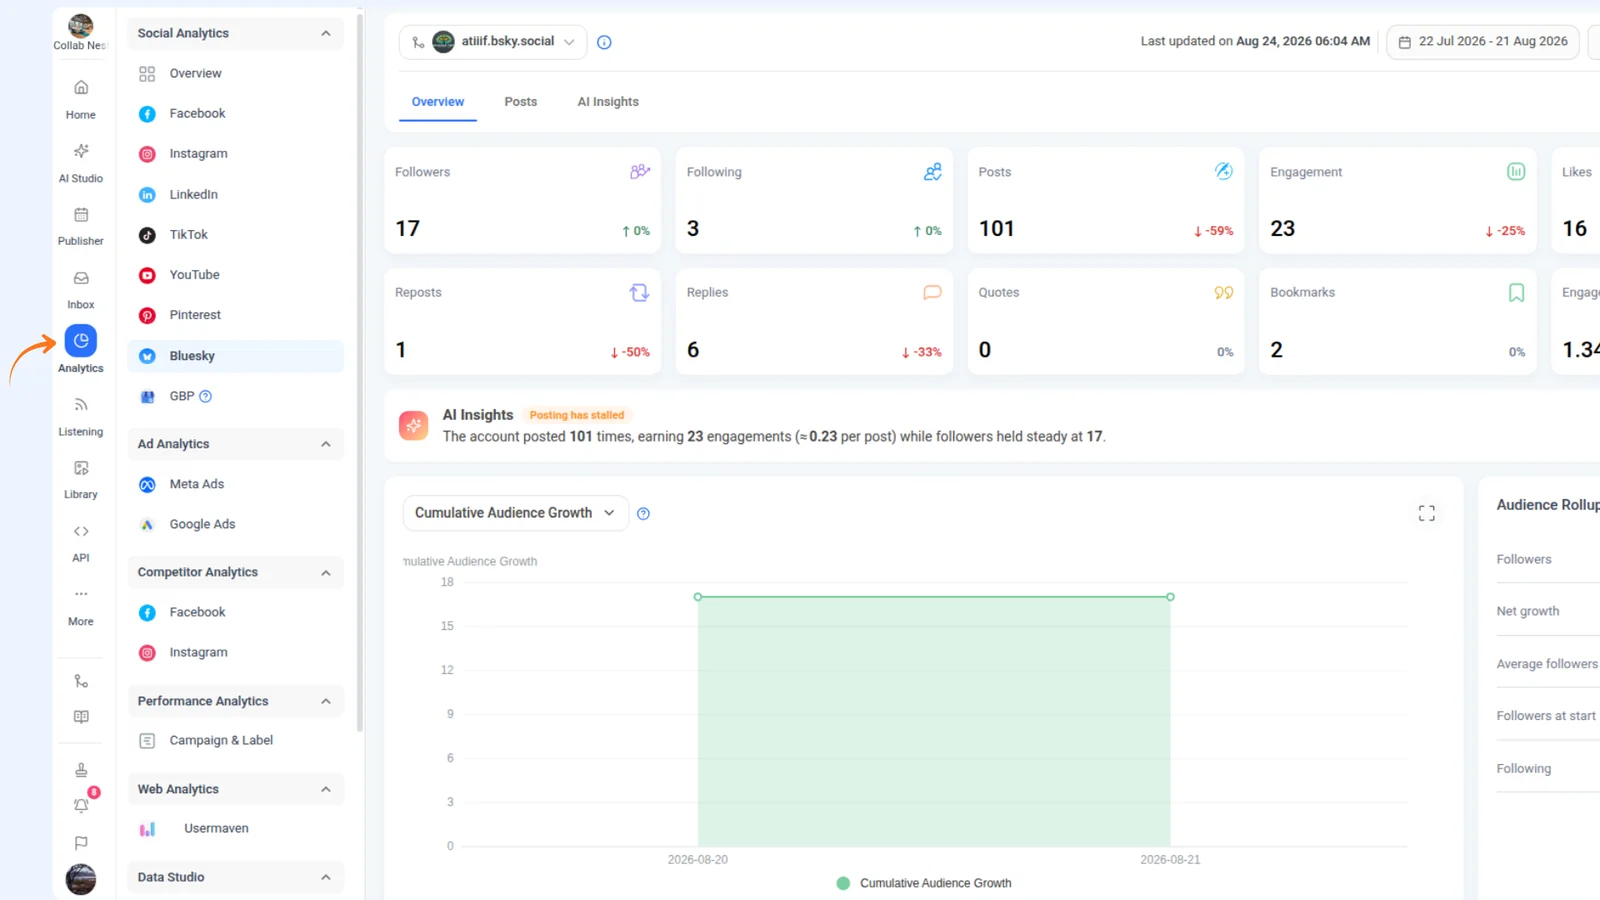
Here's how to navigate to your Bluesky Analytics dashboard inside ContentStudio.
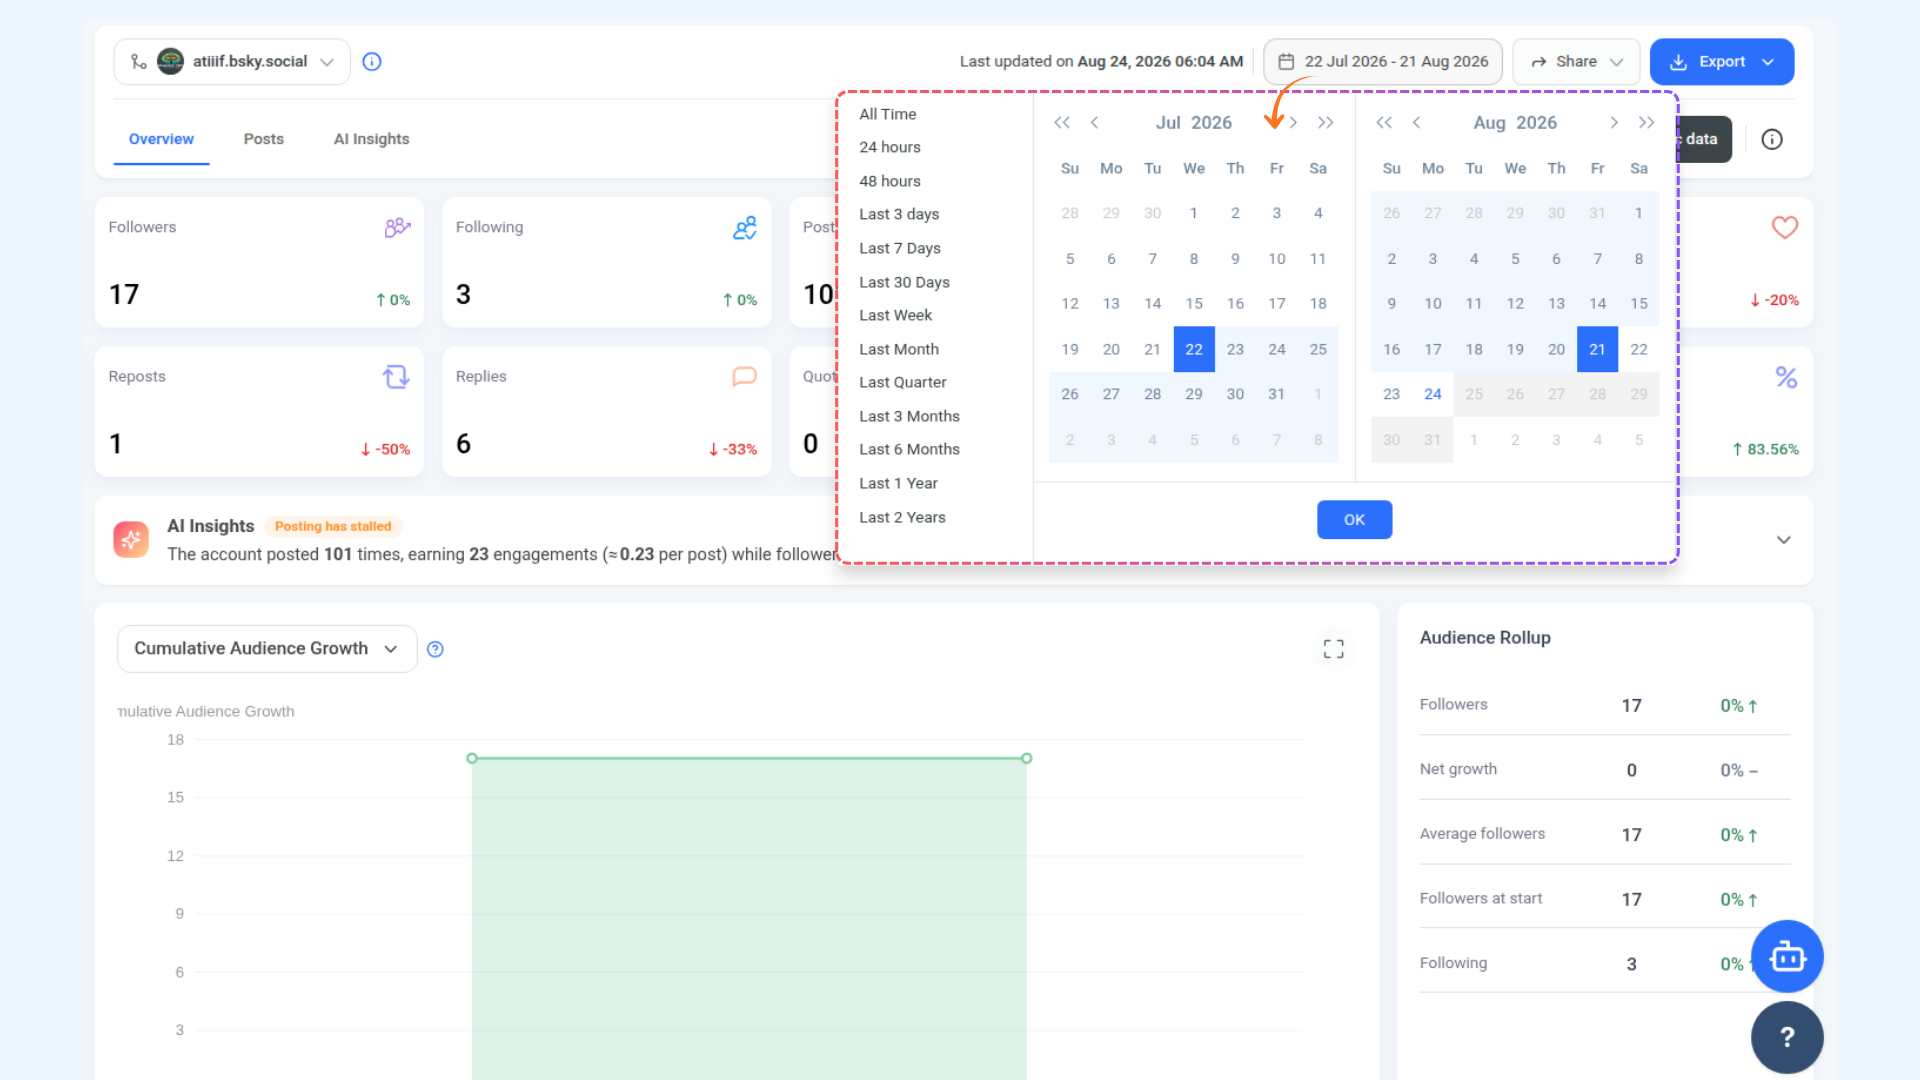
Click the date range selector in the top-right corner to adjust the reporting period. Available presets include:
- All Time
- 24 Hours / 48 Hours / Last 3 Days
- Last 7 Days / Last 30 Days
- Last Week / Last Month / Last Quarter
- Last 3 Months / Last 6 Months
- Last 1 Year / Last 2 Years
You can also pick a custom date range using the calendar pickers and click OK to apply.
Overview Tab
The Overview tab provides a high-level snapshot of your Bluesky account's performance, including how your audience and content are doing across the selected period.
Key Metrics
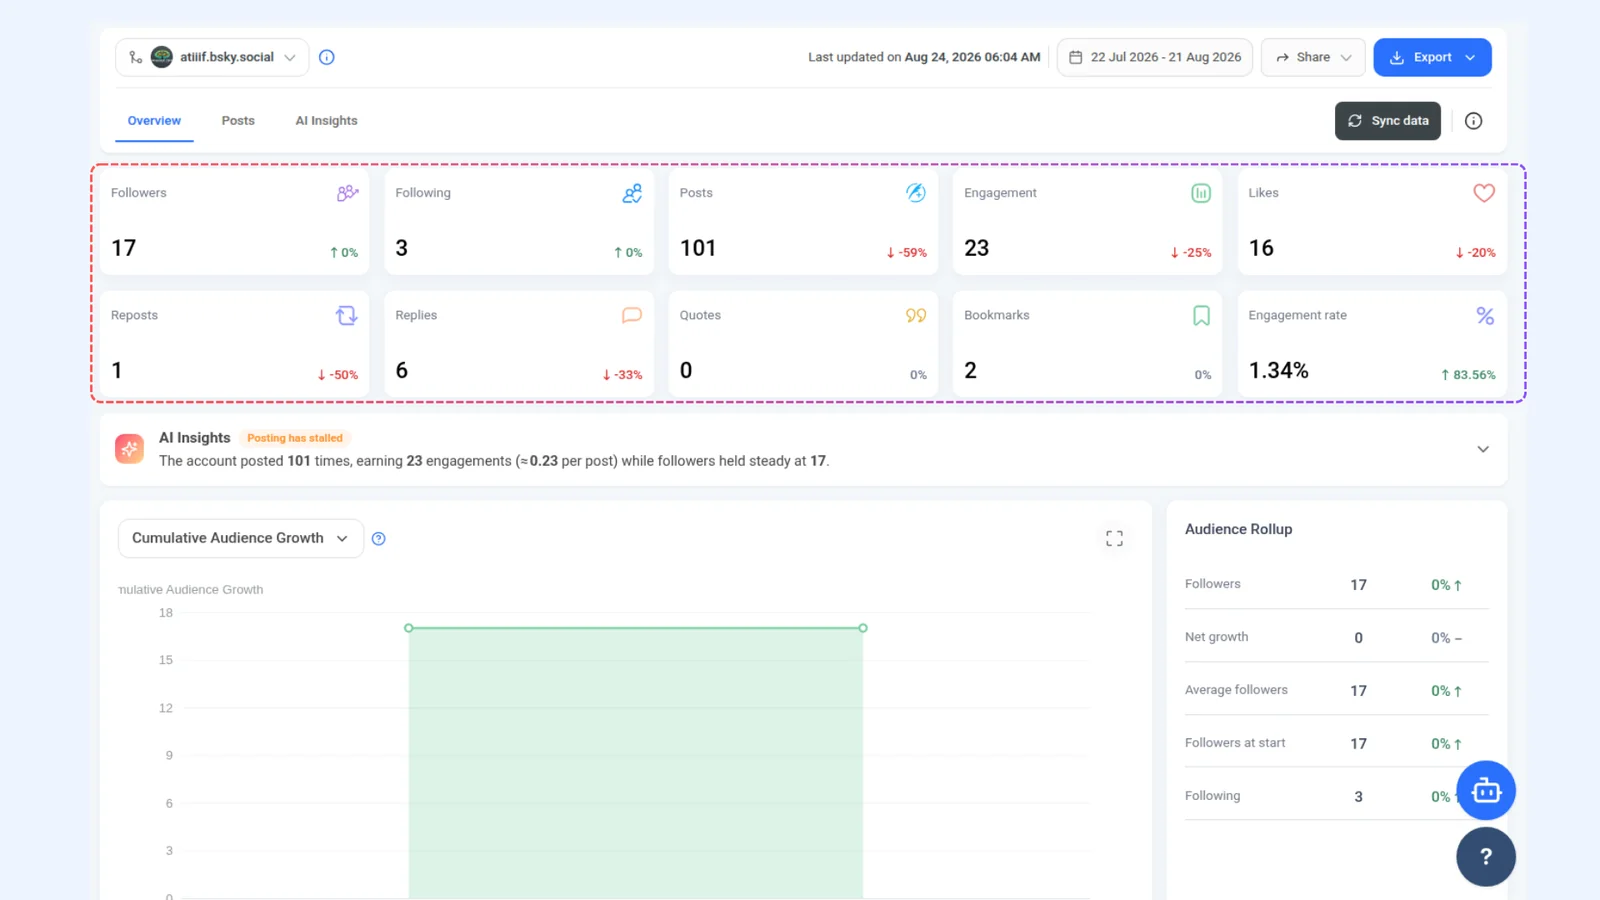
At the top of the Overview tab, you'll see a set of metric cards showing your most important numbers at a glance. Each card also shows the percentage change compared to the previous period.
The following metric cards are displayed at the top of the Overview tab:
- Followers — Total number of followers on your Bluesky account.
- Following — Total number of accounts you are following.
- Posts — Number of posts published during the selected period.
- Engagement — Total engagement actions (likes, reposts, replies, quotes) received on your posts.
- Likes — Total likes received on your posts.
- Reposts — Total number of times your posts were reposted.
- Replies — Total replies received on your posts.
- Quotes — Total number of quote posts referencing your content.
- Bookmarks — Total number of times your posts were bookmarked.
- Engagement Rate — The ratio of total engagement to your audience size, shown as a percentage.
Each metric card also shows a percentage change indicator comparing the current period to the previous one.
AI Insights
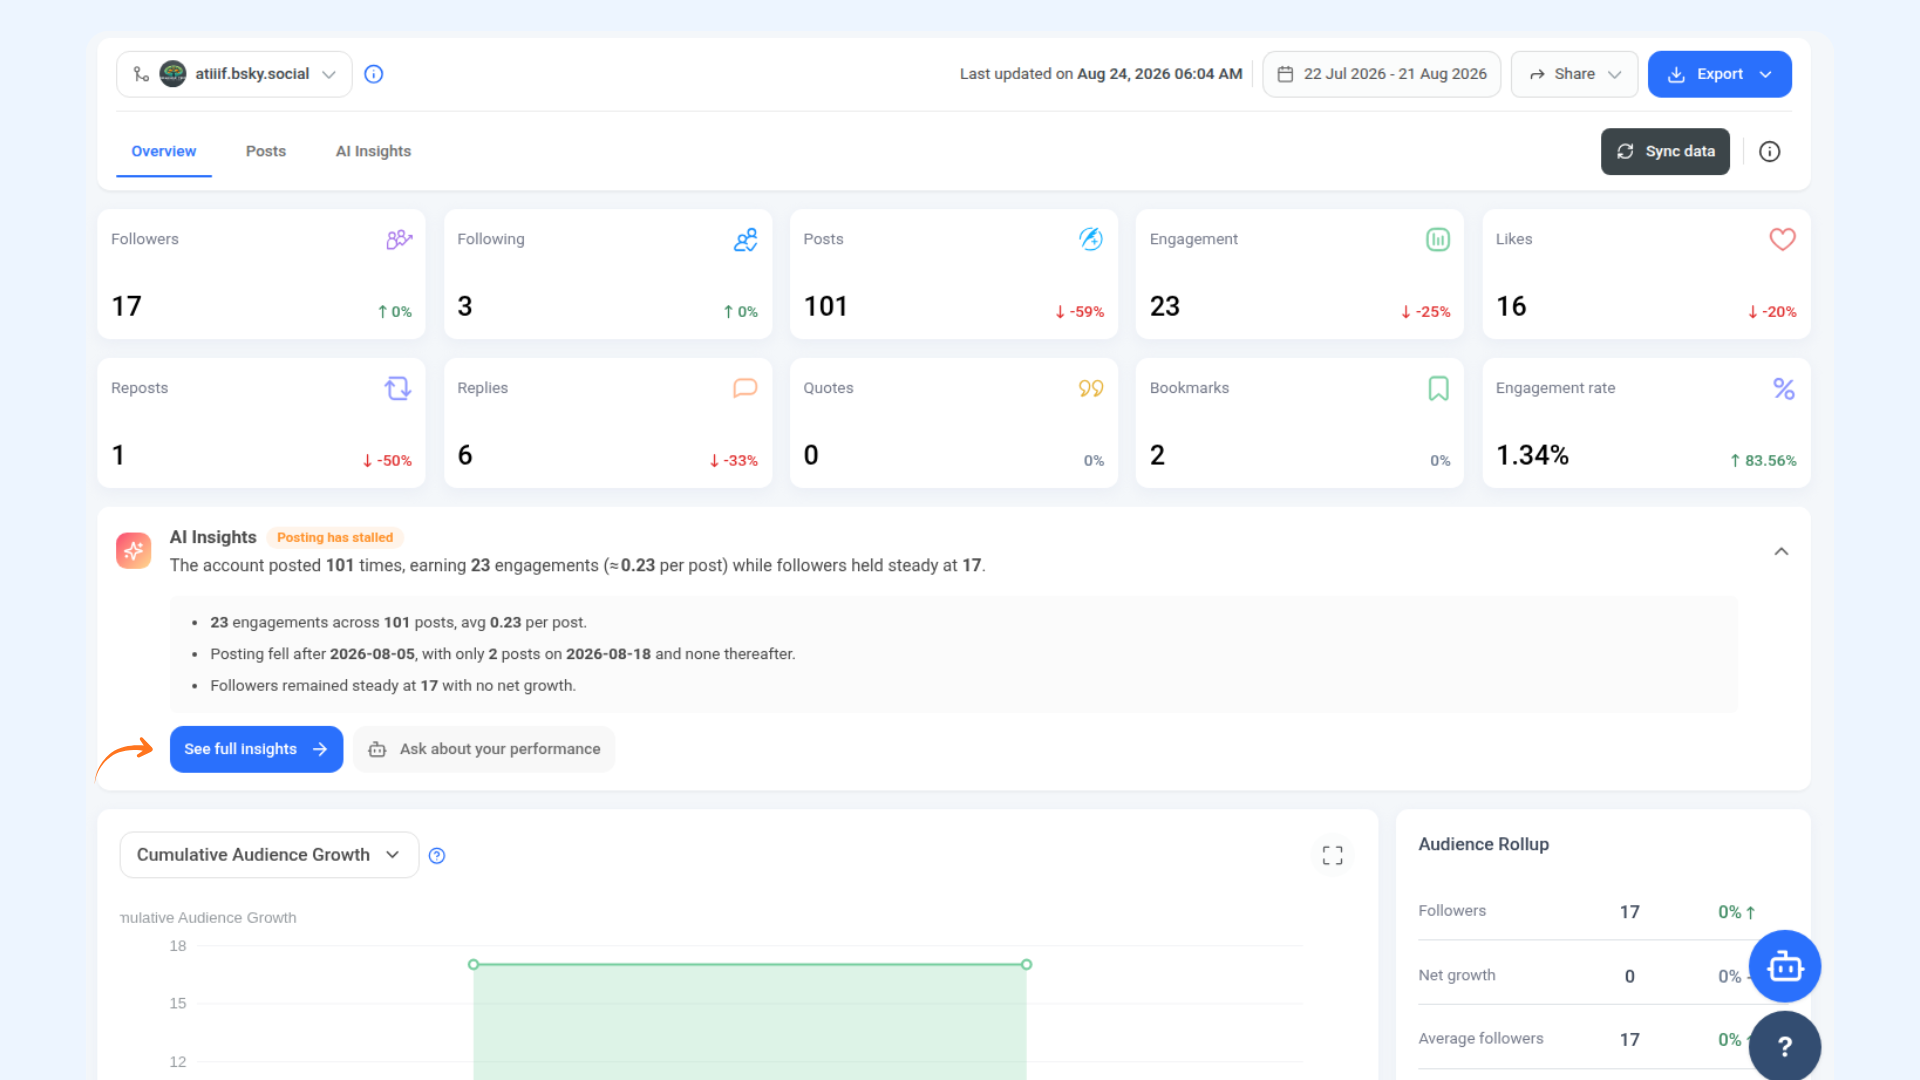
The AI Insights section on the Overview tab automatically reads your account data and generates a summary of trends, observations, and recommendations.
The AI Insights section sits below the key metric cards on the Overview tab. It automatically reads your account data and generates a summary of performance trends and recommendations.
Click the expand arrow to view the full insights. If there isn't enough data for the selected period, you'll see a message saying "Not enough data to generate insights for this period."
Cumulative Audience Growth
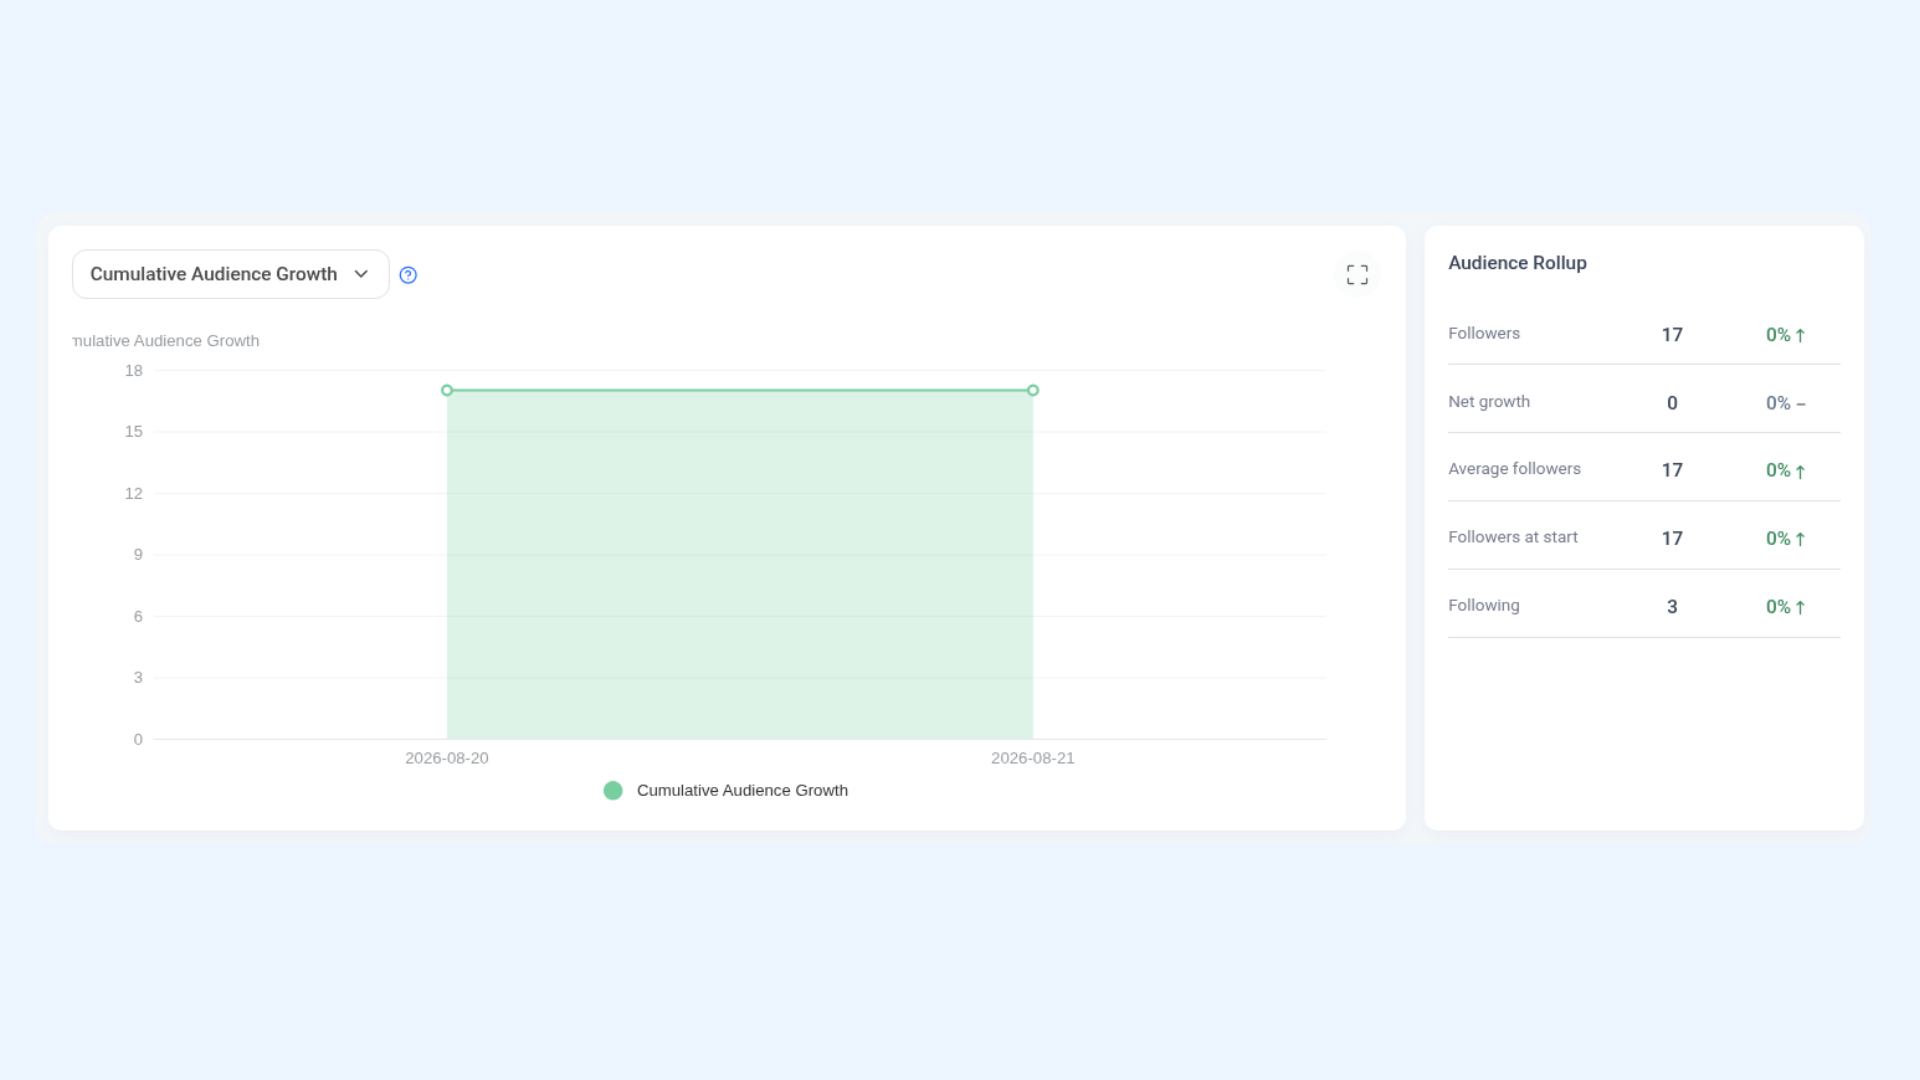
The Cumulative Audience Growth chart tracks how your Bluesky audience has grown over the selected time period.
This chart visualizes your follower growth over time. Use the dropdown above the chart to toggle between different audience views.
The Audience Rollup panel on the right provides a quick summary of key audience numbers:
- Followers — Current total follower count.
- Net Growth — Net change in followers during the selected period.
- Average Followers — Average daily follower count.
- Followers at Start — Follower count at the beginning of the selected period.
- Following — Total accounts you're following.
Engagement
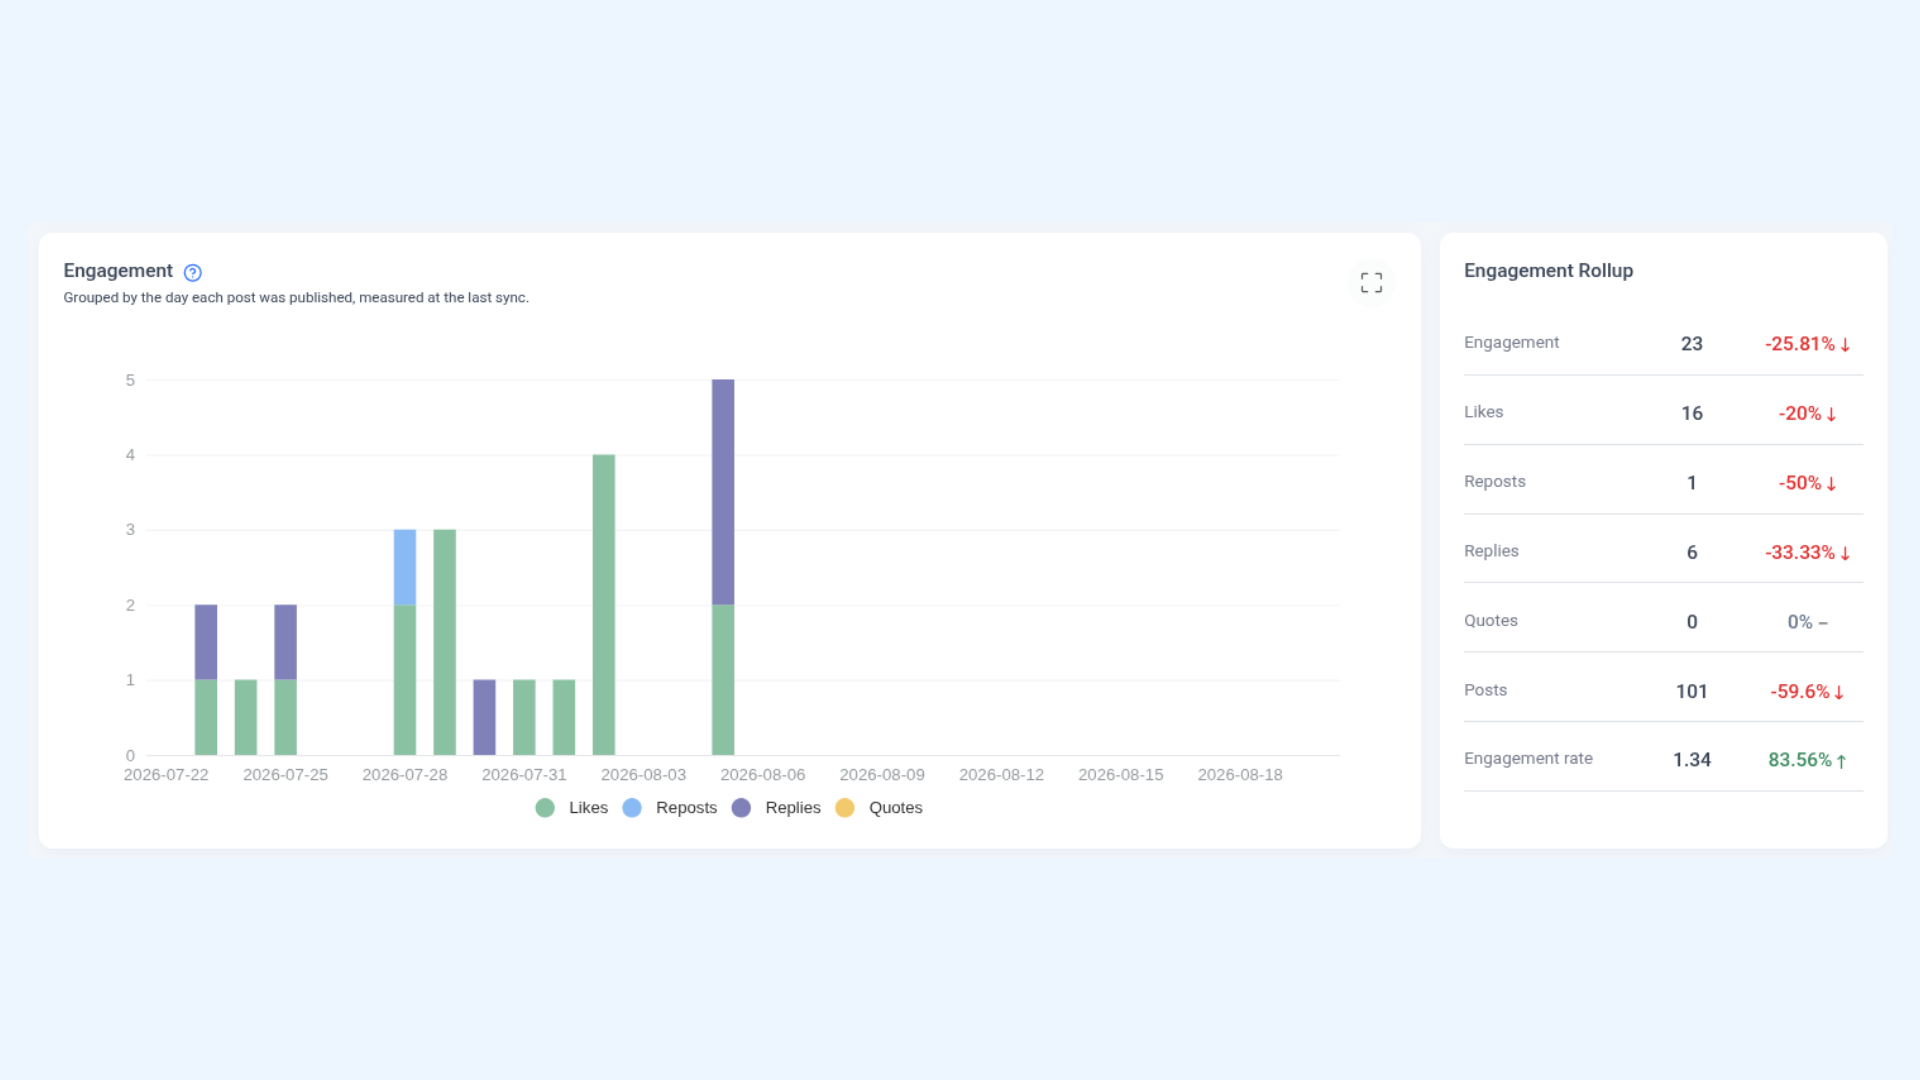
The Engagement section shows how your audience is interacting with your posts over the selected period.
This chart displays engagement data grouped by the day each post was published, measured at the last sync. Hover over any data point to view the exact value for that day.
The Engagement Rollup panel on the right provides a summary including:
- Engagement — Total engagement actions.
- Likes — Total likes received.
- Reposts — Total reposts.
- Replies — Total replies received.
- Quotes — Total quote posts.
- Posts — Total posts published.
- Engagement Rate — Overall engagement rate for the period.
Posting by Day
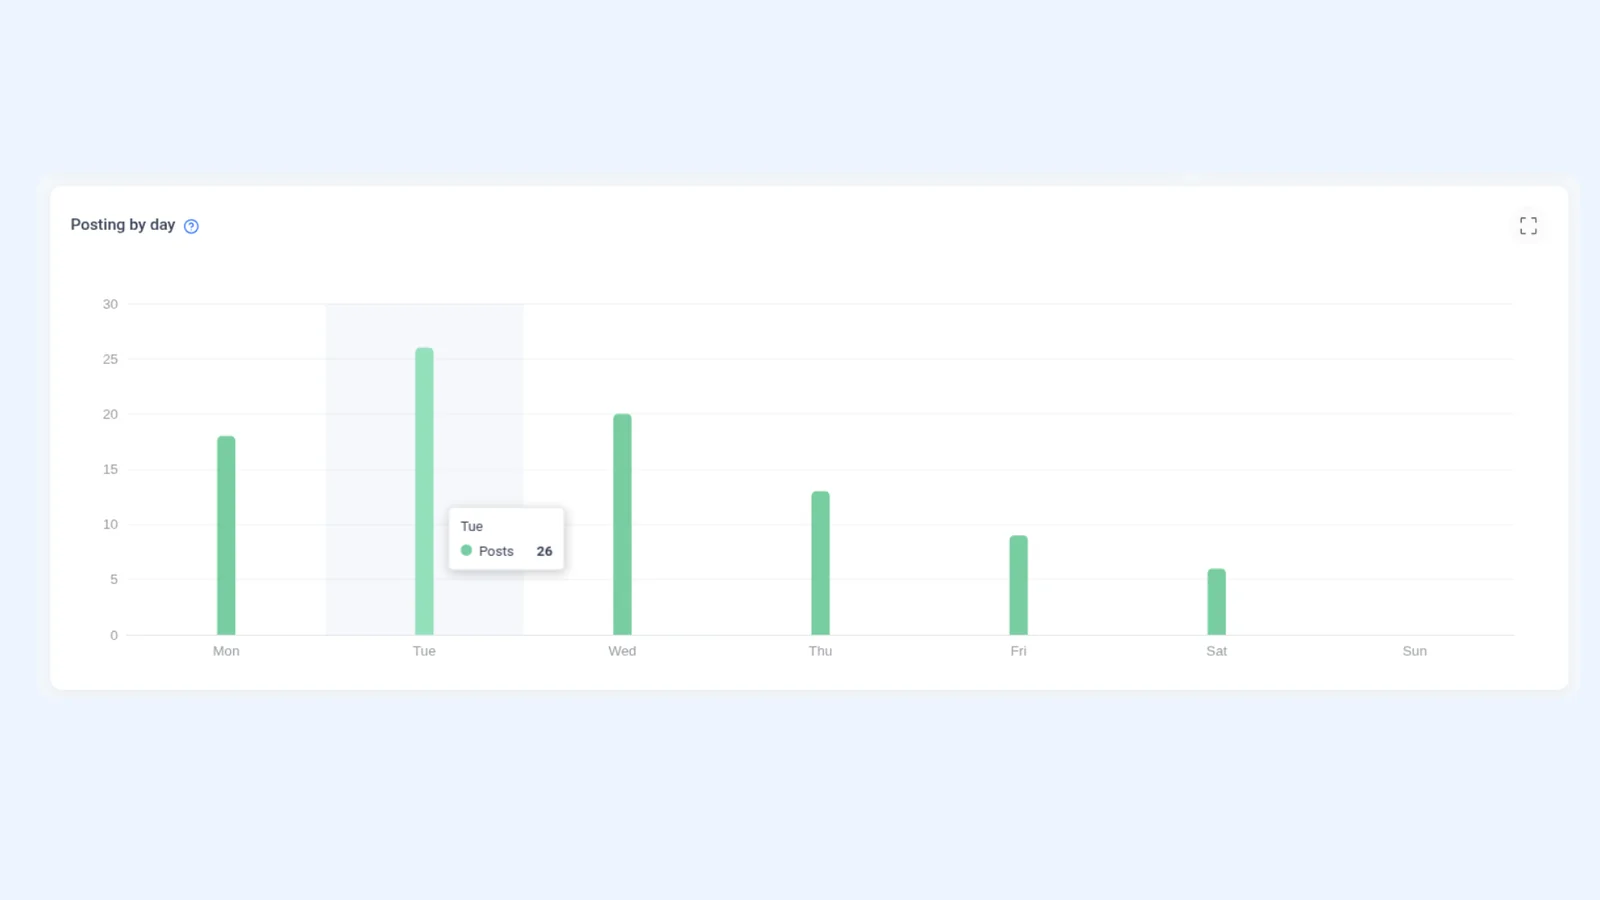
The Posting by Day chart shows how your posting activity is distributed across different days of the week.
This chart shows how your posts are distributed across the days of the week during the selected period. Use it to identify which days you're most active on and plan your posting schedule accordingly.
Posting by Hour
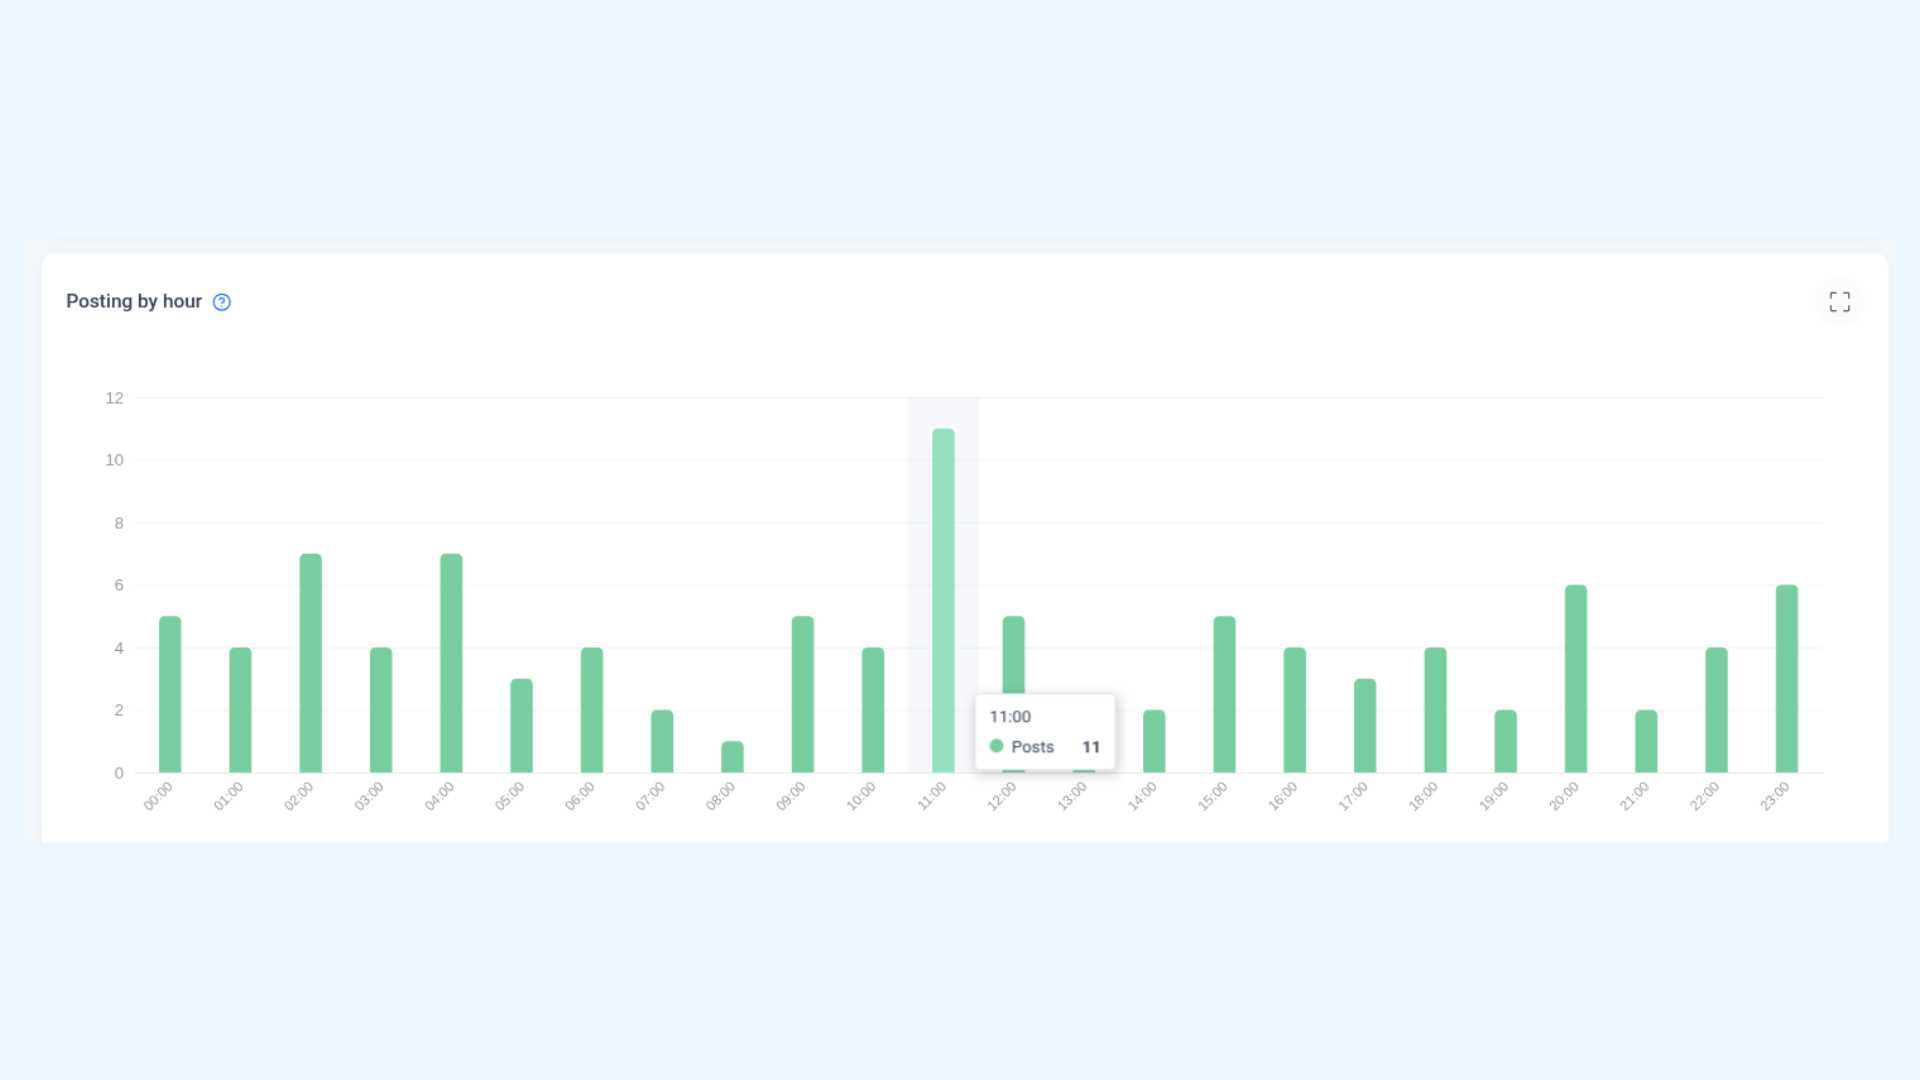
The Posting by Hour chart shows the time of day your posts were published, helping you understand your posting habits and optimize your schedule.
This chart breaks down your posting activity by hour of the day. Use it to see when you typically publish content and determine whether shifting your posting times could improve engagement.
Publishing Behaviour Breakdown
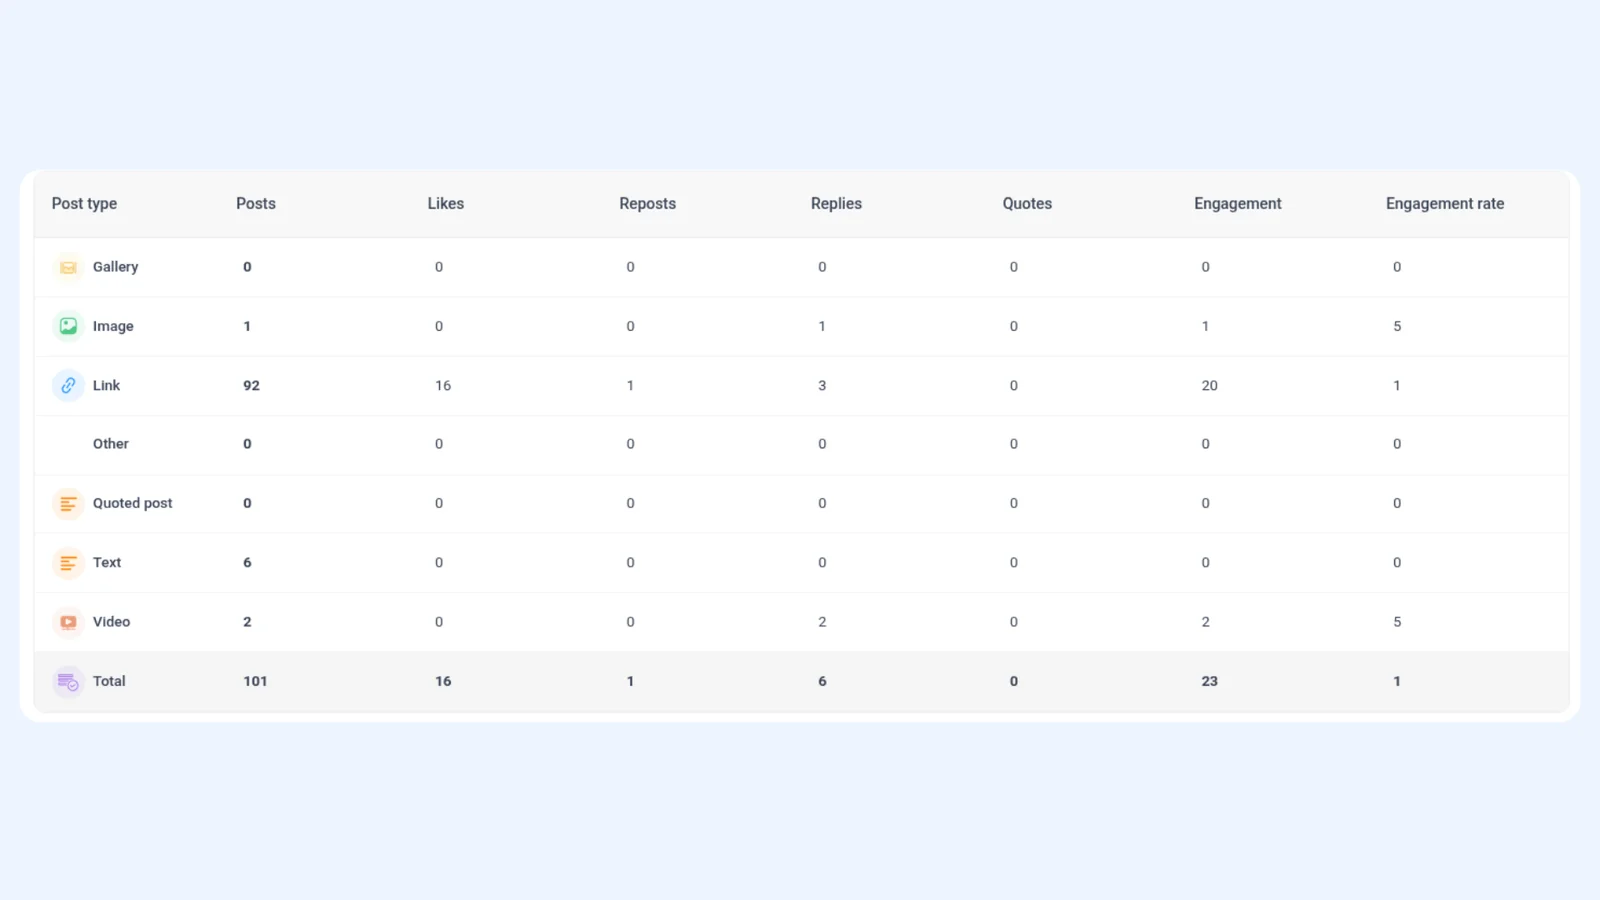
The Publishing Behaviour Breakdown table gives you a detailed view of how different types of posts are performing on your Bluesky account.
This table breaks down your posting activity by content type. For each type, you'll see the number of posts along with the engagement breakdown:
- Gallery — Posts with multiple images.
- Image — Posts with a single image.
- Link — Posts containing a link.
- Other — Posts that don't fall into the above categories.
- Quoted Post — Posts that quote another Bluesky post.
- Video — Posts containing a video.
Each row shows the count of Posts, Likes, Reposts, Replies, Quotes, total Engagement, and Engagement Rate for that content type.
Top Hashtags
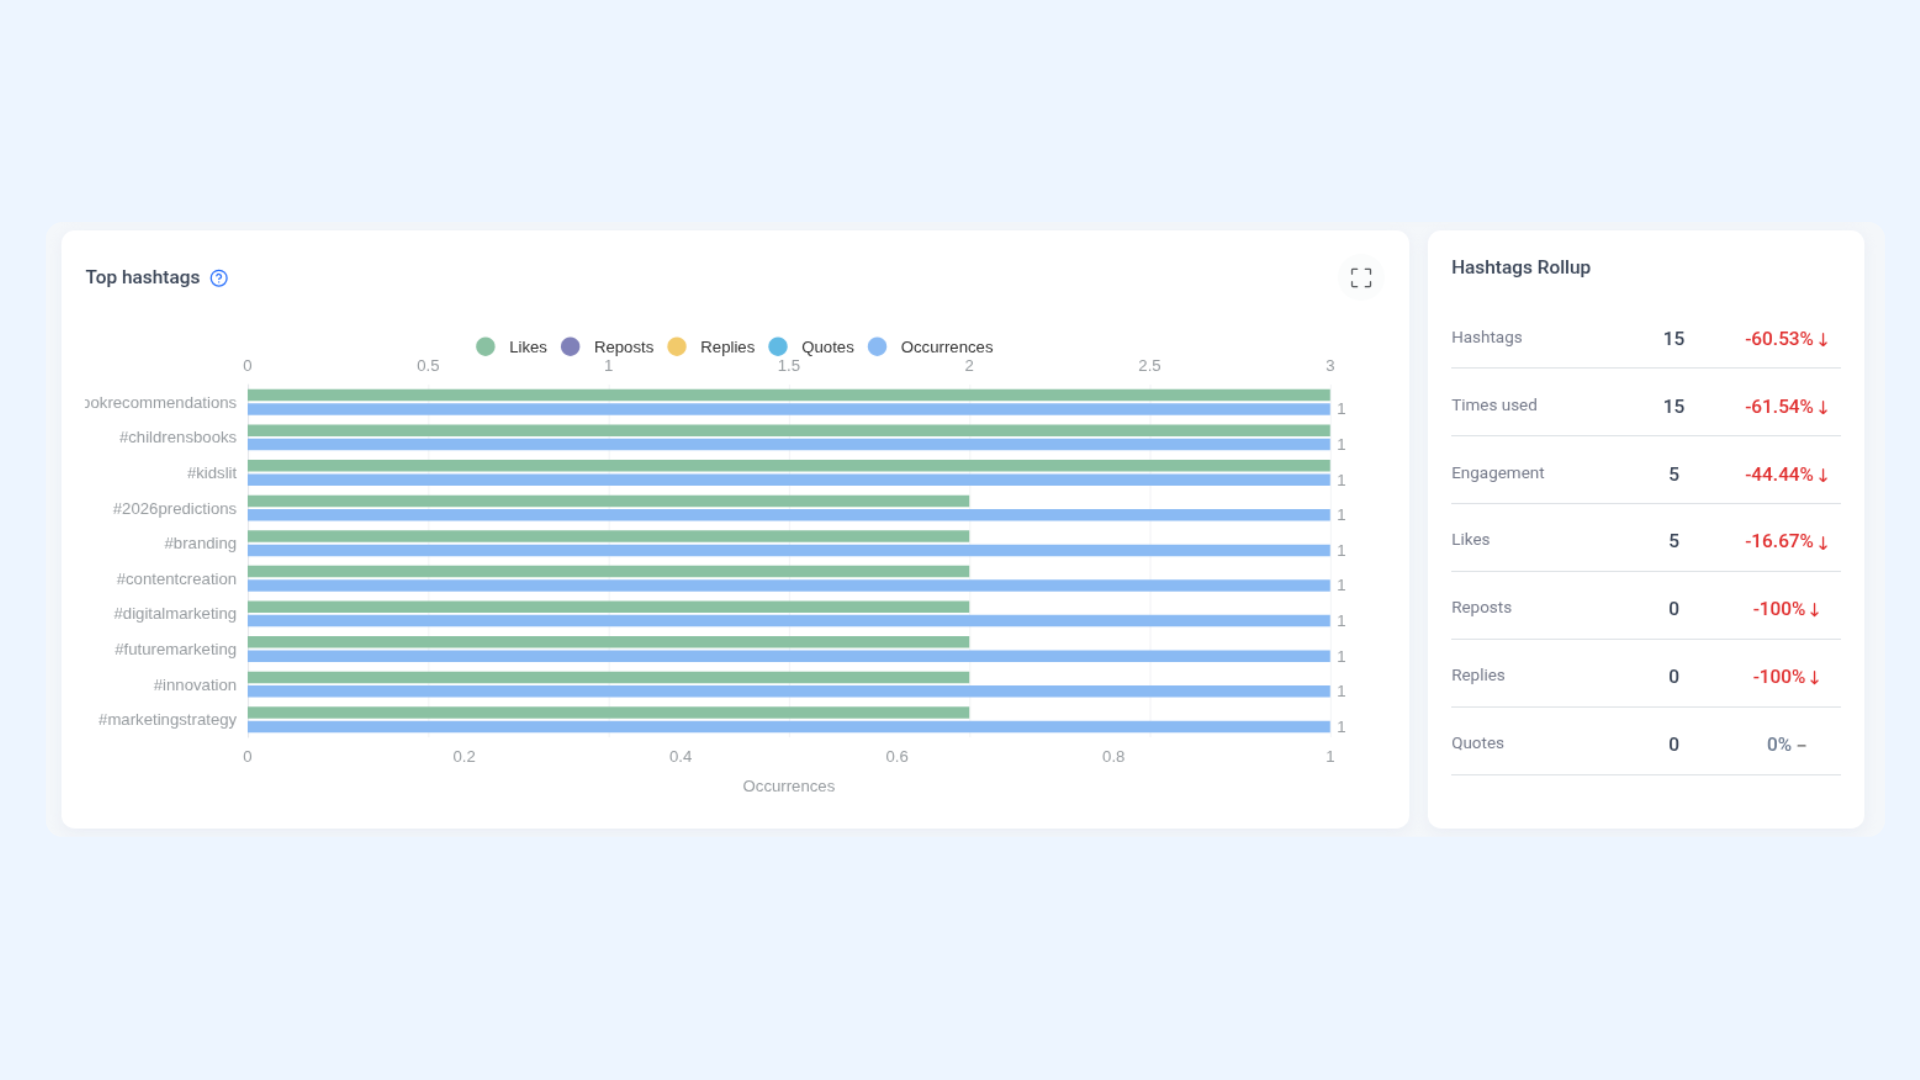
The Top Hashtags section shows which hashtags you've used the most and how they performed during the selected period.
This section highlights your most-used hashtags and their engagement metrics. The Hashtags Rollup panel on the right shows:
- Hashtags — Total unique hashtags used.
- Times Used — How many times hashtags were included in posts.
- Engagement — Total engagement from posts using hashtags.
- Likes — Likes on hashtagged posts.
- Reposts — Reposts on hashtagged posts.
- Replies — Replies on hashtagged posts.
- Quotes — Quotes on hashtagged posts.
Top Posts
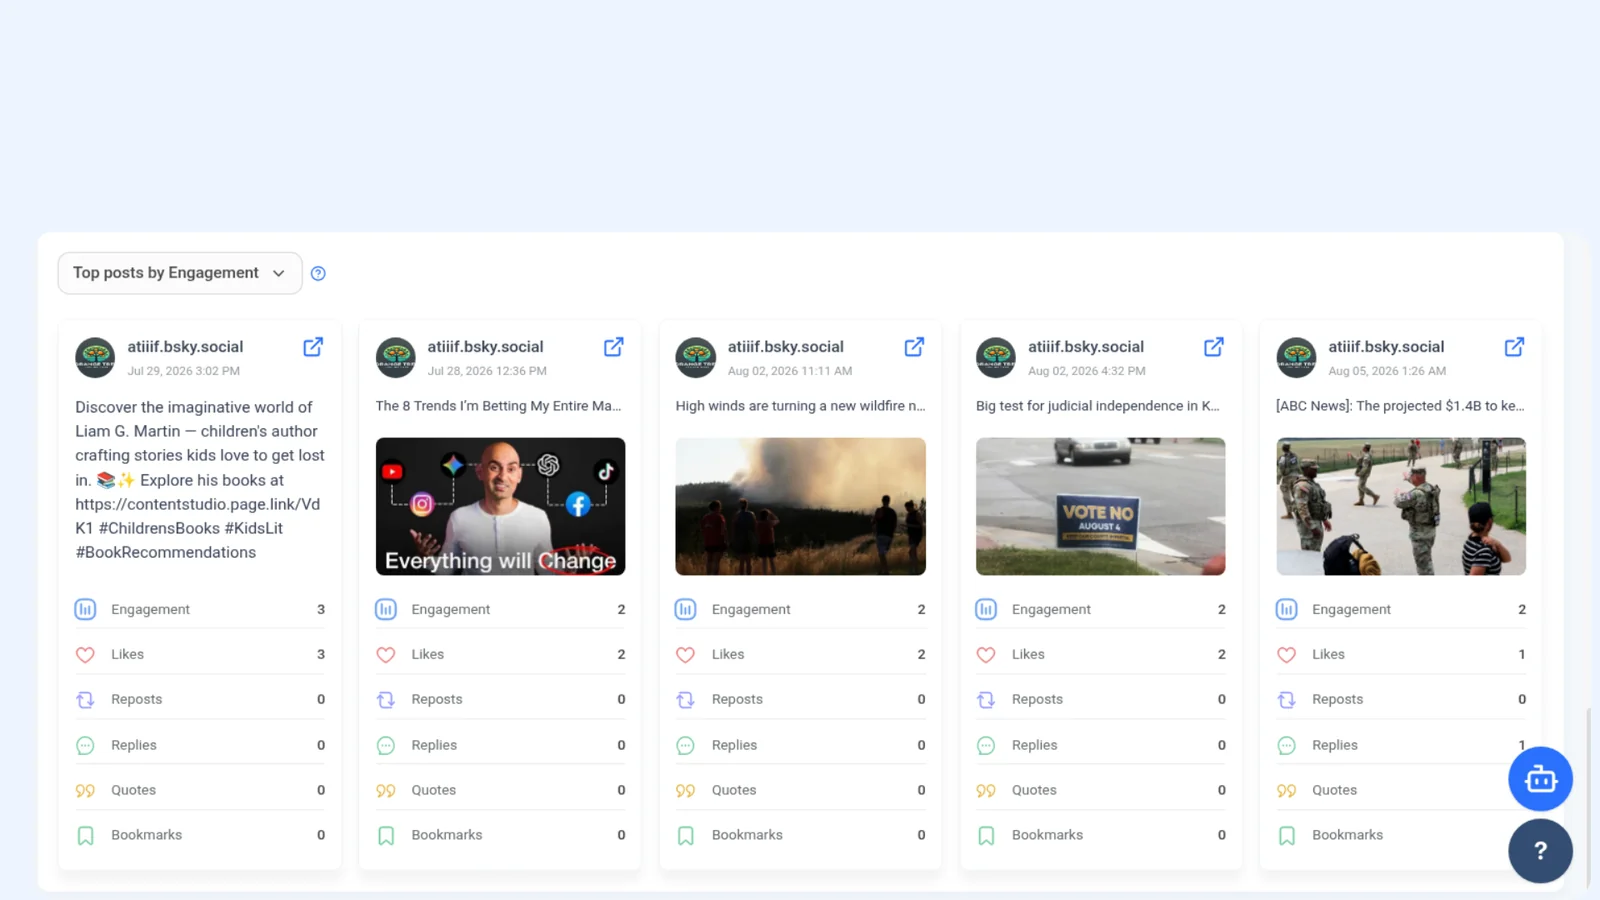
This section lists your top-performing posts ranked by total engagement (likes + reposts + replies + quotes). Use the dropdown to switch the ranking criteria. It's a quick way to see what content resonates most with your Bluesky audience.
FAQs
How often does Bluesky Analytics data update?
Your analytics data updates each time you click the Sync data button. You can manually sync at any time to pull the latest numbers from your Bluesky account.
Can I track multiple Bluesky accounts?
Yes. If you have more than one Bluesky account connected to ContentStudio, use the account selector dropdown at the top of the dashboard to switch between them.
Why does the AI Insights tab say "Not enough data"?
This happens when there isn't enough posting or engagement activity during the selected period for the AI to generate meaningful insights. Try selecting a longer date range like Last 3 Months or Last 6 Months.
Why don't I see impressions or reach data for Bluesky?
Bluesky does not publish impressions or reach data, so the analytics dashboard reports interactions only — likes, reposts, replies, quotes, and bookmarks.
What's the difference between Engagement and Engagement Rate?
Engagement is the total count of all interactions (likes, reposts, replies, quotes) your posts received. Engagement Rate is that total expressed as a percentage relative to your audience size, giving you a normalized view of how well your content is performing.
Why does my follower trend chart start from a specific date instead of showing full history?
Follower trends start from when the account was connected to ContentStudio. The AT Protocol does not return follower history from before that point, so earlier data is not available.
What does "previous period" mean in the percentage changes?
It refers to the same number of days immediately before your selected date range. For example, if you're viewing the last 30 days, the previous period is the 30 days before that.
What time zone is the data displayed in?
All analytics data is displayed according to your workspace's time zone setting.
Can I schedule recurring analytics reports for Bluesky?
Yes. Click the Export button in the top-right corner, select Schedule PDF, and set up a recurring delivery to any email address.
Was this article helpful?