

TikTok analytics
TikTok Analytics provides insights into your performance, revealing top-performing posts, audience demographics, and growth trends. Analyze insights to tailor your strategies, make informed decisions, and maximize content impact.
Your secret weapon for TikTok success awaits; let's dive in! 🚀
In this article:
Accessing TikTok Analytics
Step 1: Navigate to Analyze from the dashboard.
Step 2: Go to "Social Analytics," then click "TikTok" in the left panel. This opens up your TikTok analytics dashboard.
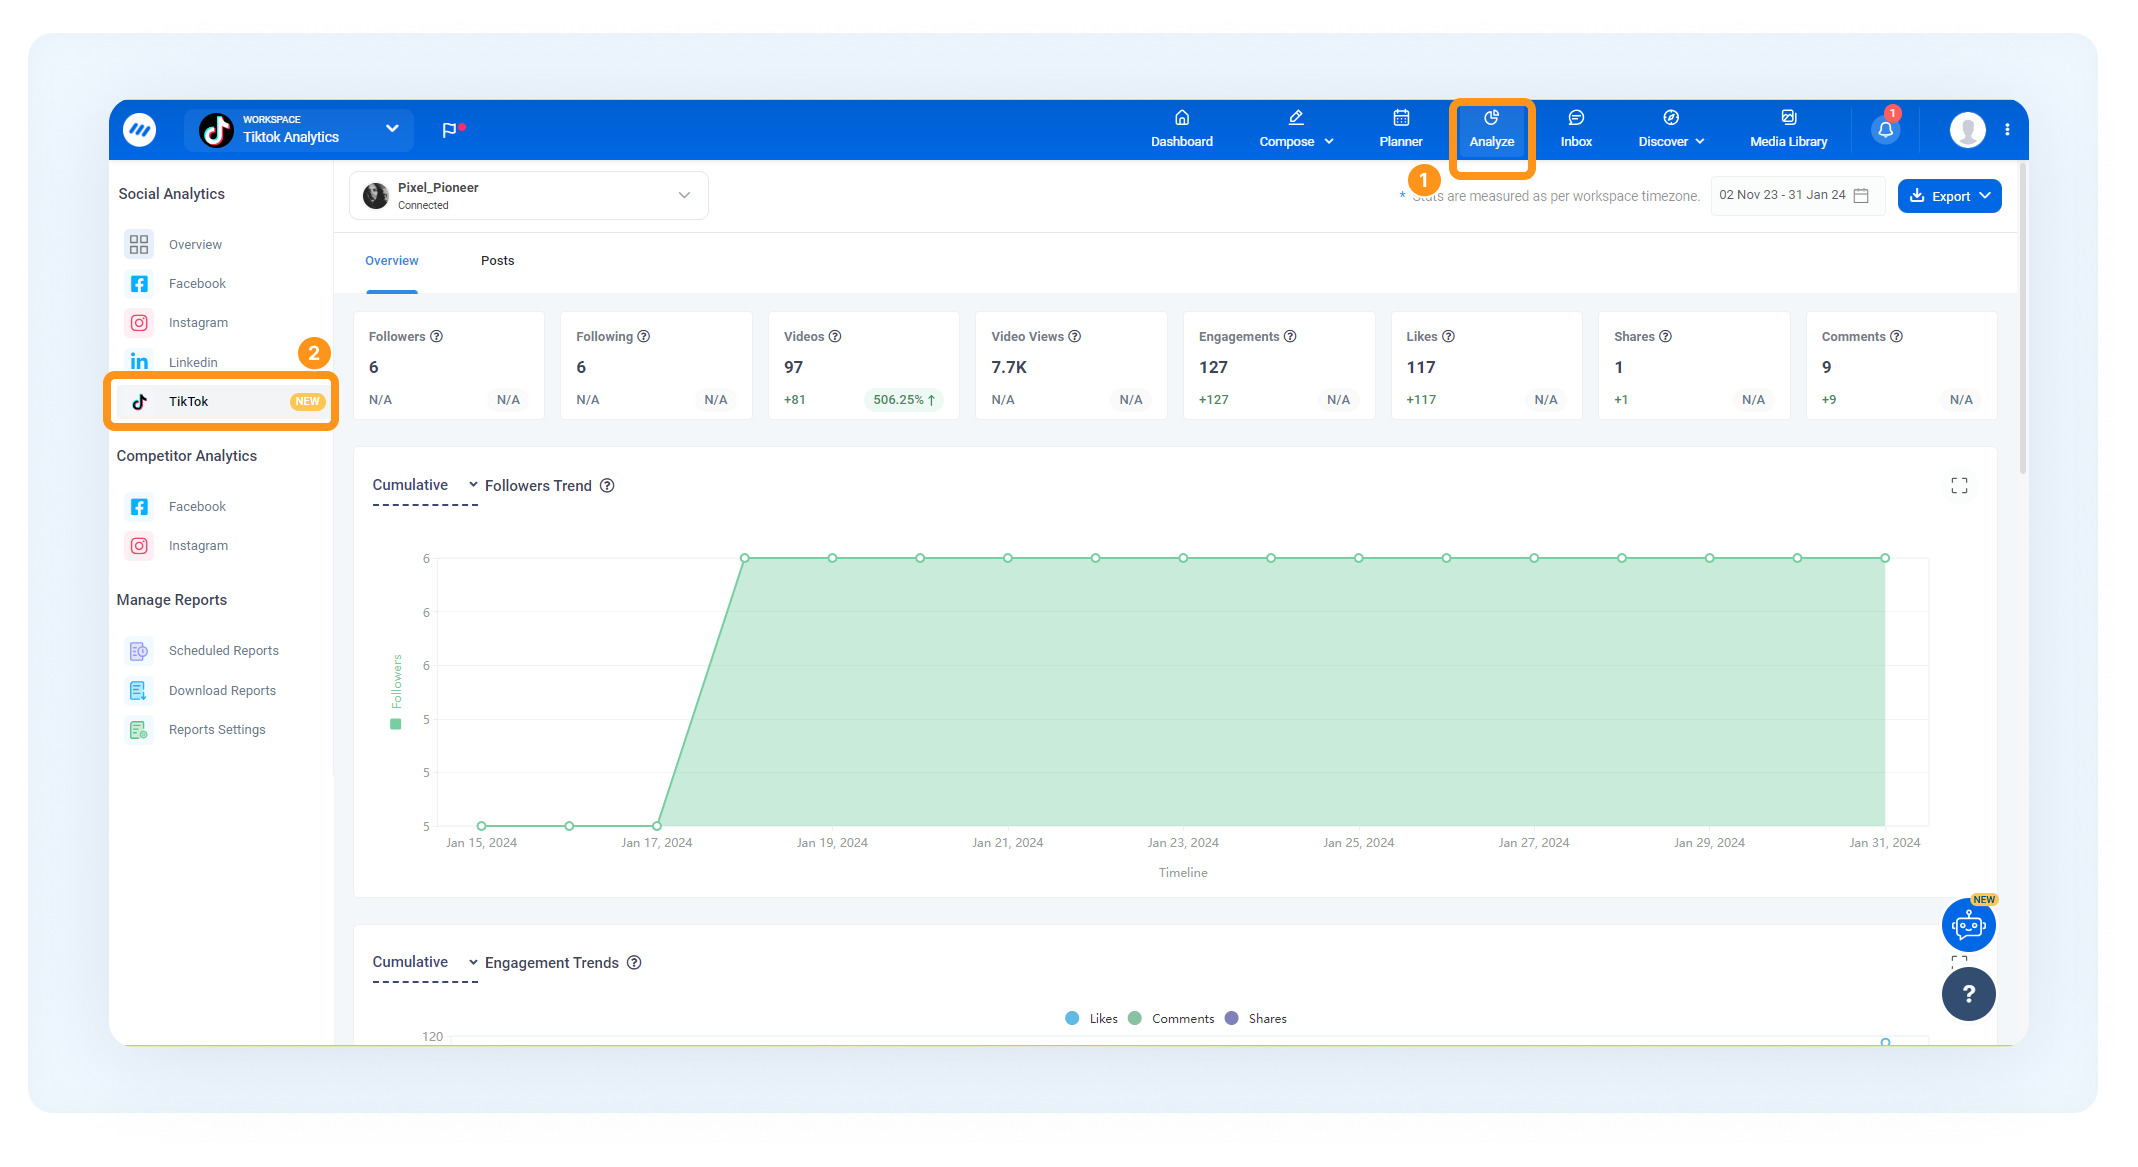
Analytics Dashboard
Once you're in the TikTok Analytics section, you'll notice there are two main tabs to explore: the Overview Tab and the Posts Tab.
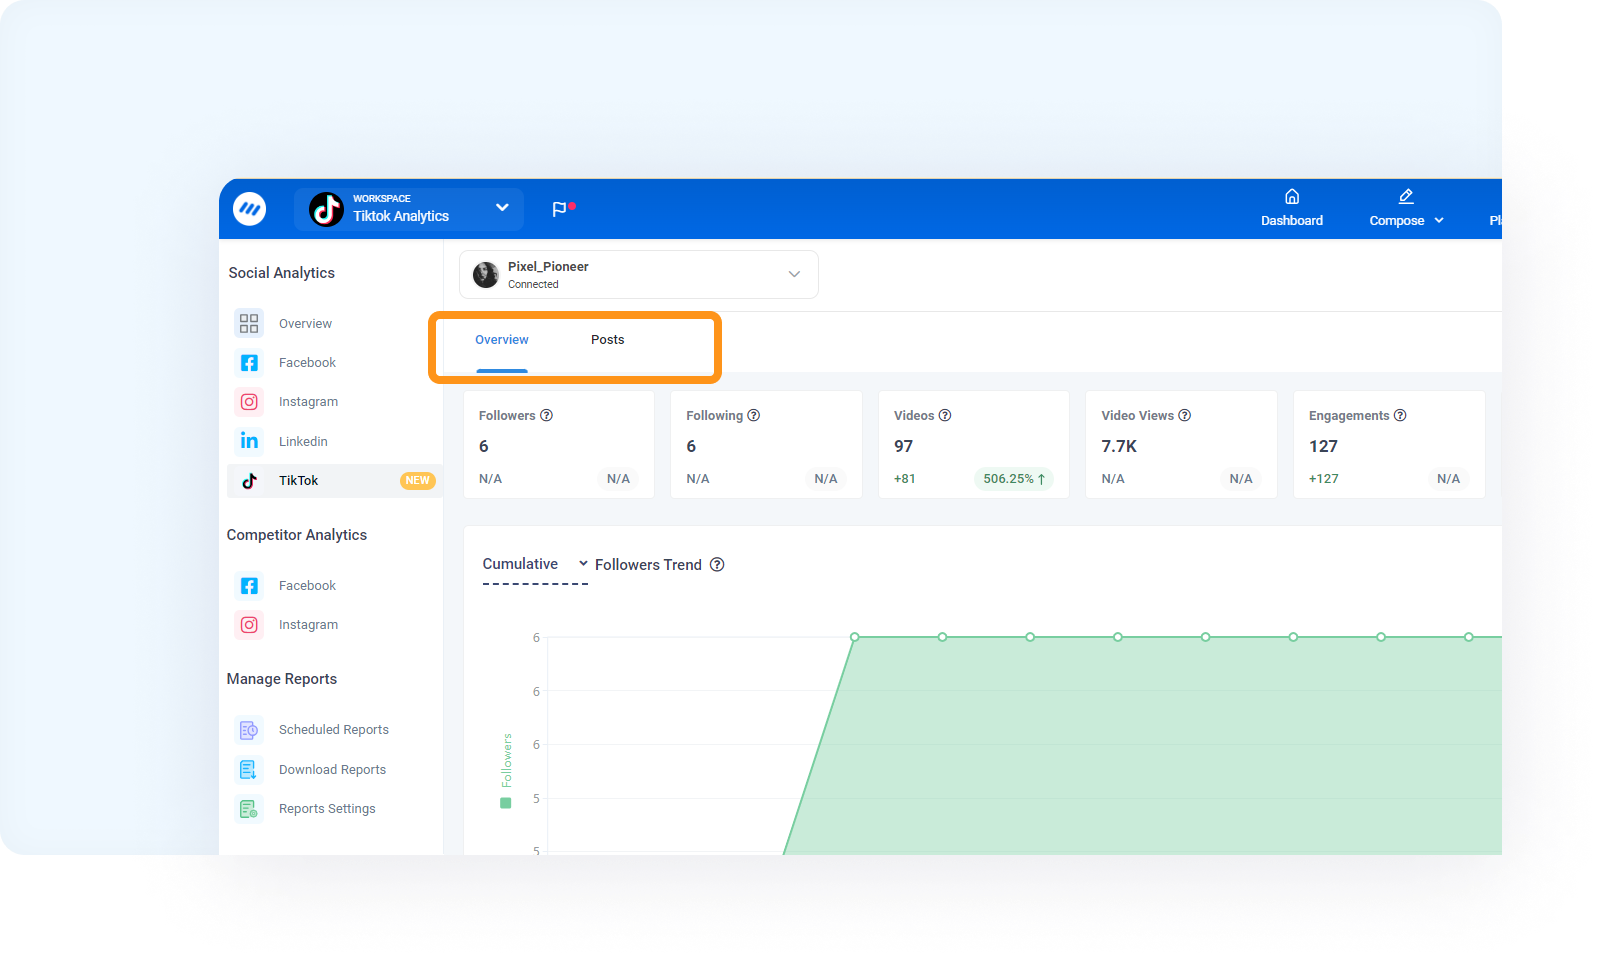
Overview Tab
Here, you get a high-level snapshot of your TikTok performance. The Overview Tab provides key metrics and trends at a glance.
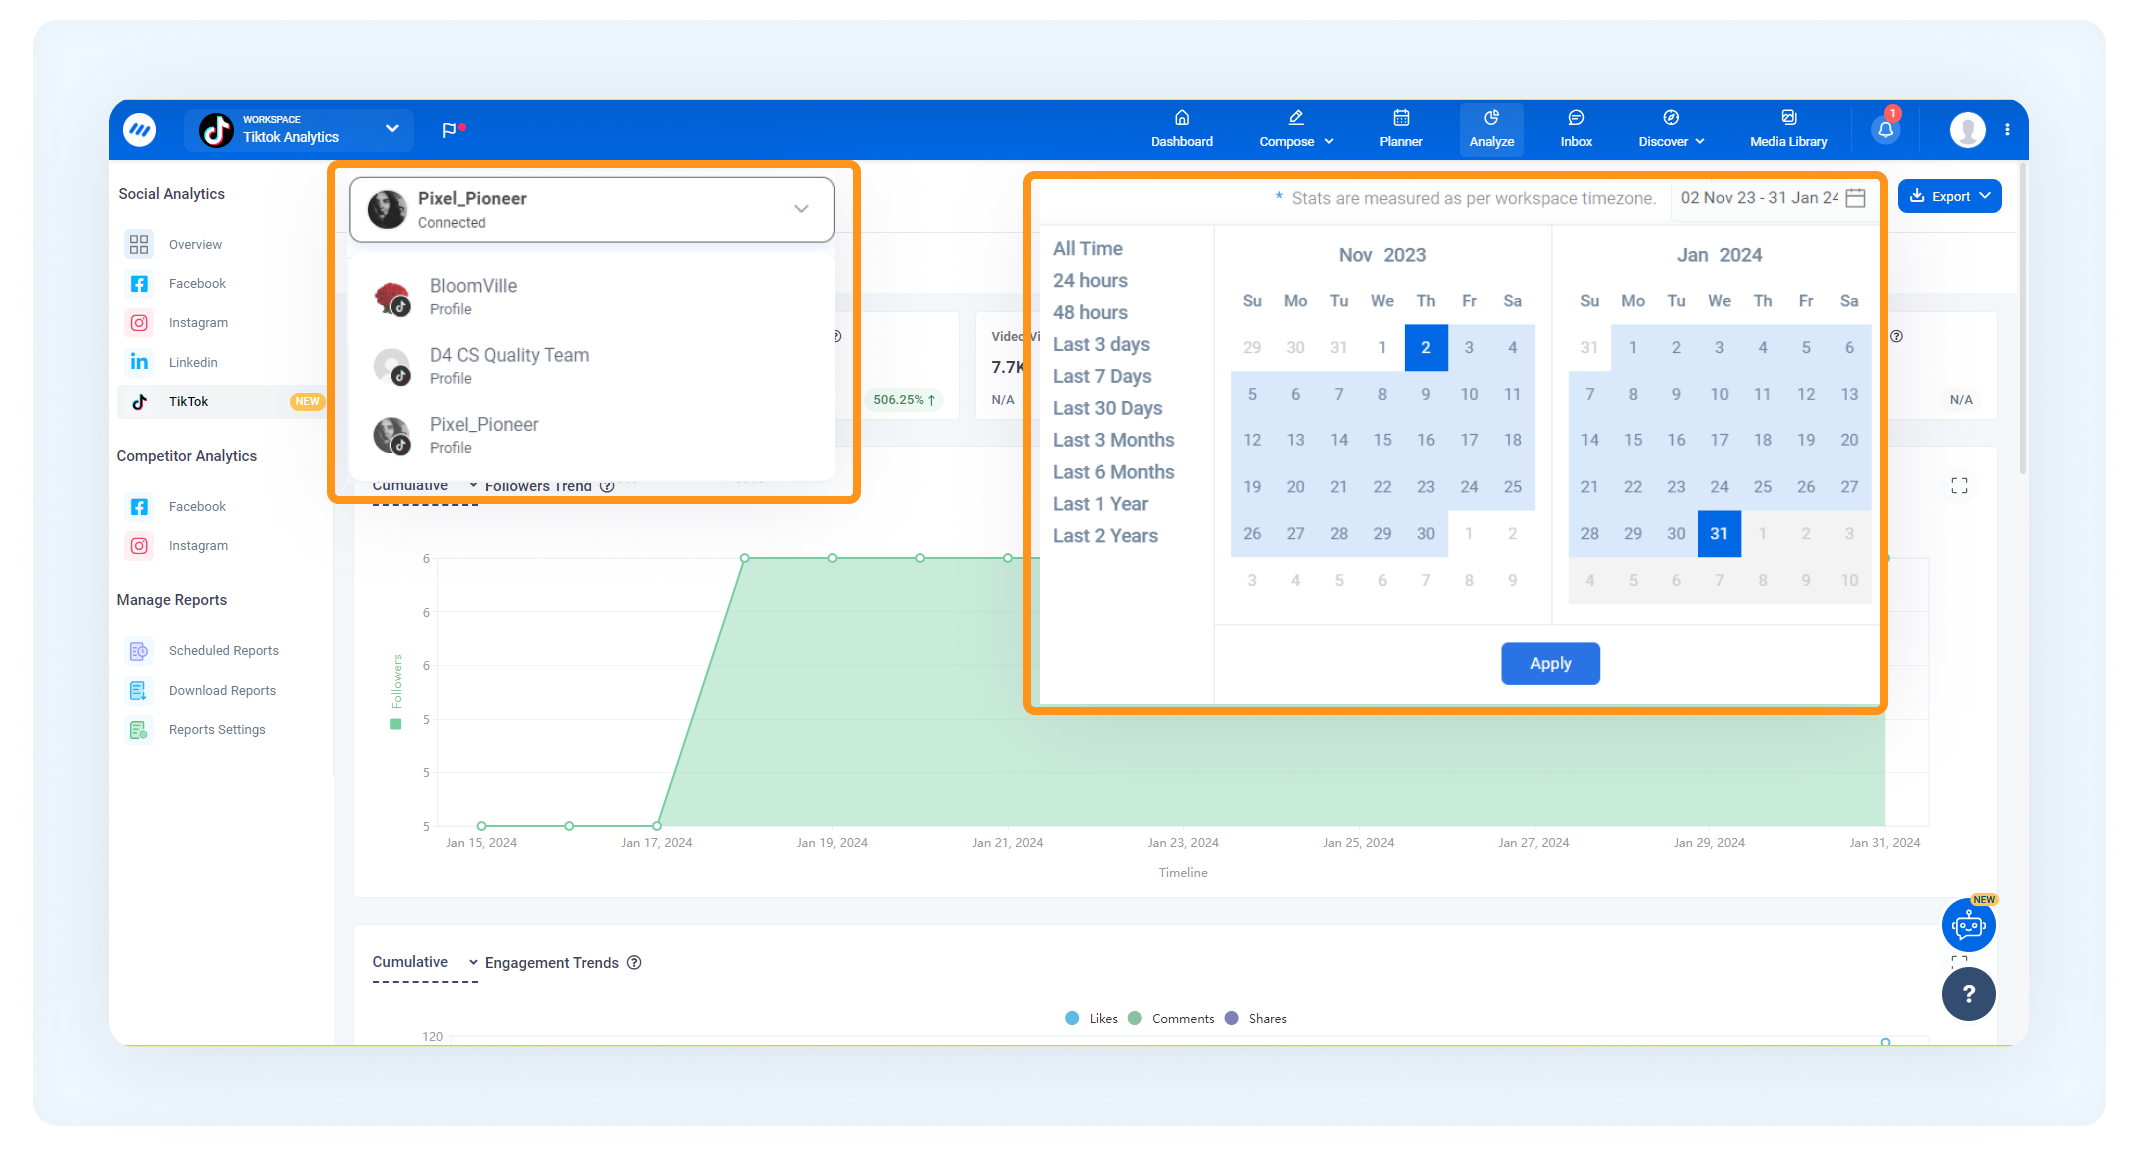
Your first TikTok account is selected by default, but if you have multiple pages, you can select any of them from the dropdown.
Select a date range to analyze; the default is the past 30 days. Predefined ranges are also available for quick selection.
As you explore the TikTok Analytics dashboard, you'll see several informative cards, each packed with essential data about your TikTok account. Each card contains:
Total count
Net increase or decrease as compared to the previous time period
Percentage rate of change as compared to previous time periods
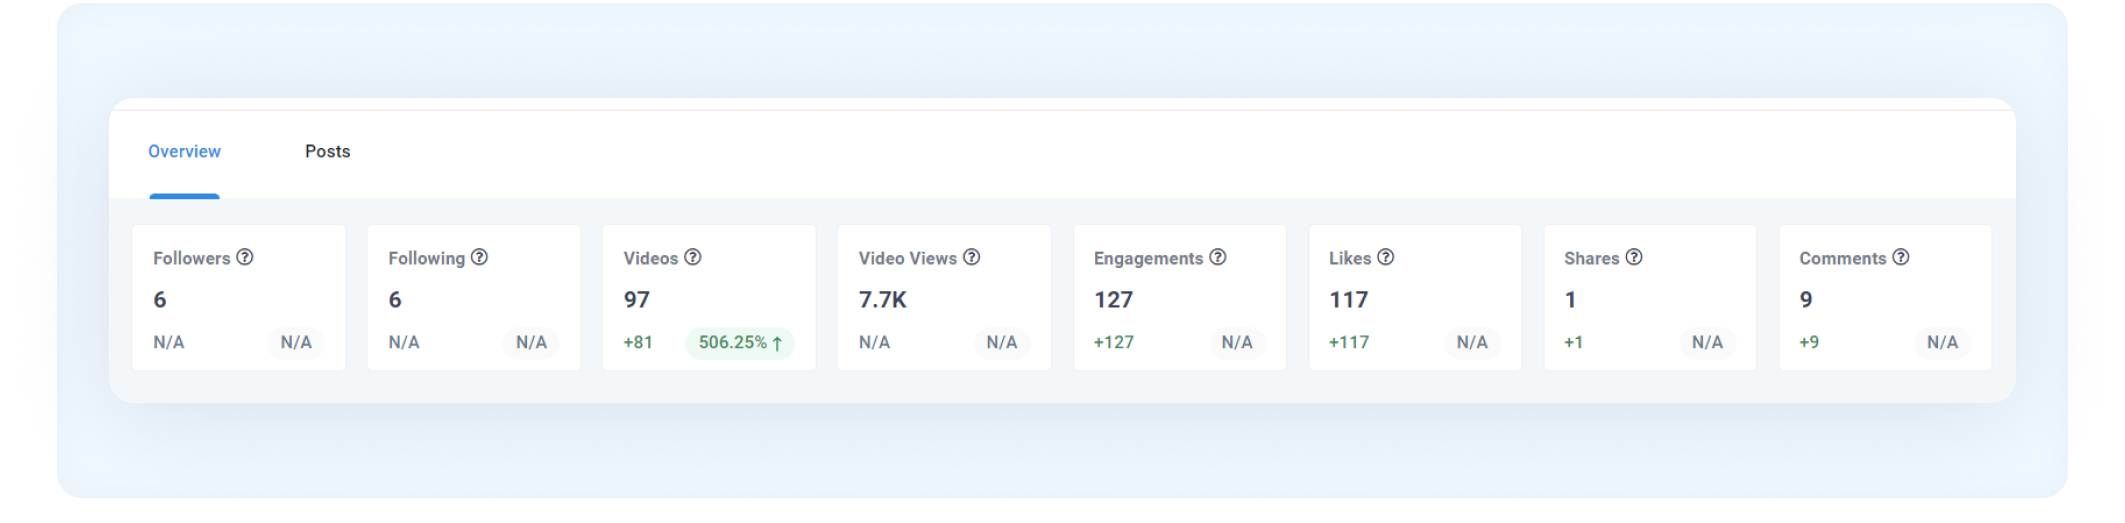
N/A: means that the data is not available.
Following are the key metrics offered by ContentStudio
Followers: The total number of people following your TikTok up to the end of the selected time period.
Following: The total number of accounts you are subscribed to on TikTok up to the end of the selected time period.
Videos: The total number of videos published on your TikTok account during the selected time period.
Video Views: The total number of times your videos have been watched up to the end of the selected time period, regardless of their publication date.
Engagements: The total number of engagement actions (likes, comments, and shares) on all the video posts published during the selected time period, based on their lifetime performance.
Likes: The total number of hearts received on all the video posts published during the selected time period, based on their lifetime performance.
Shares: The total number of times all video posts (published during the selected time period) have been forwarded to others or shared on different platforms, based on their lifetime performance.
Comments: The total number of comments left by viewers on all the video posts published during the selected time period, based on their lifetime performance.
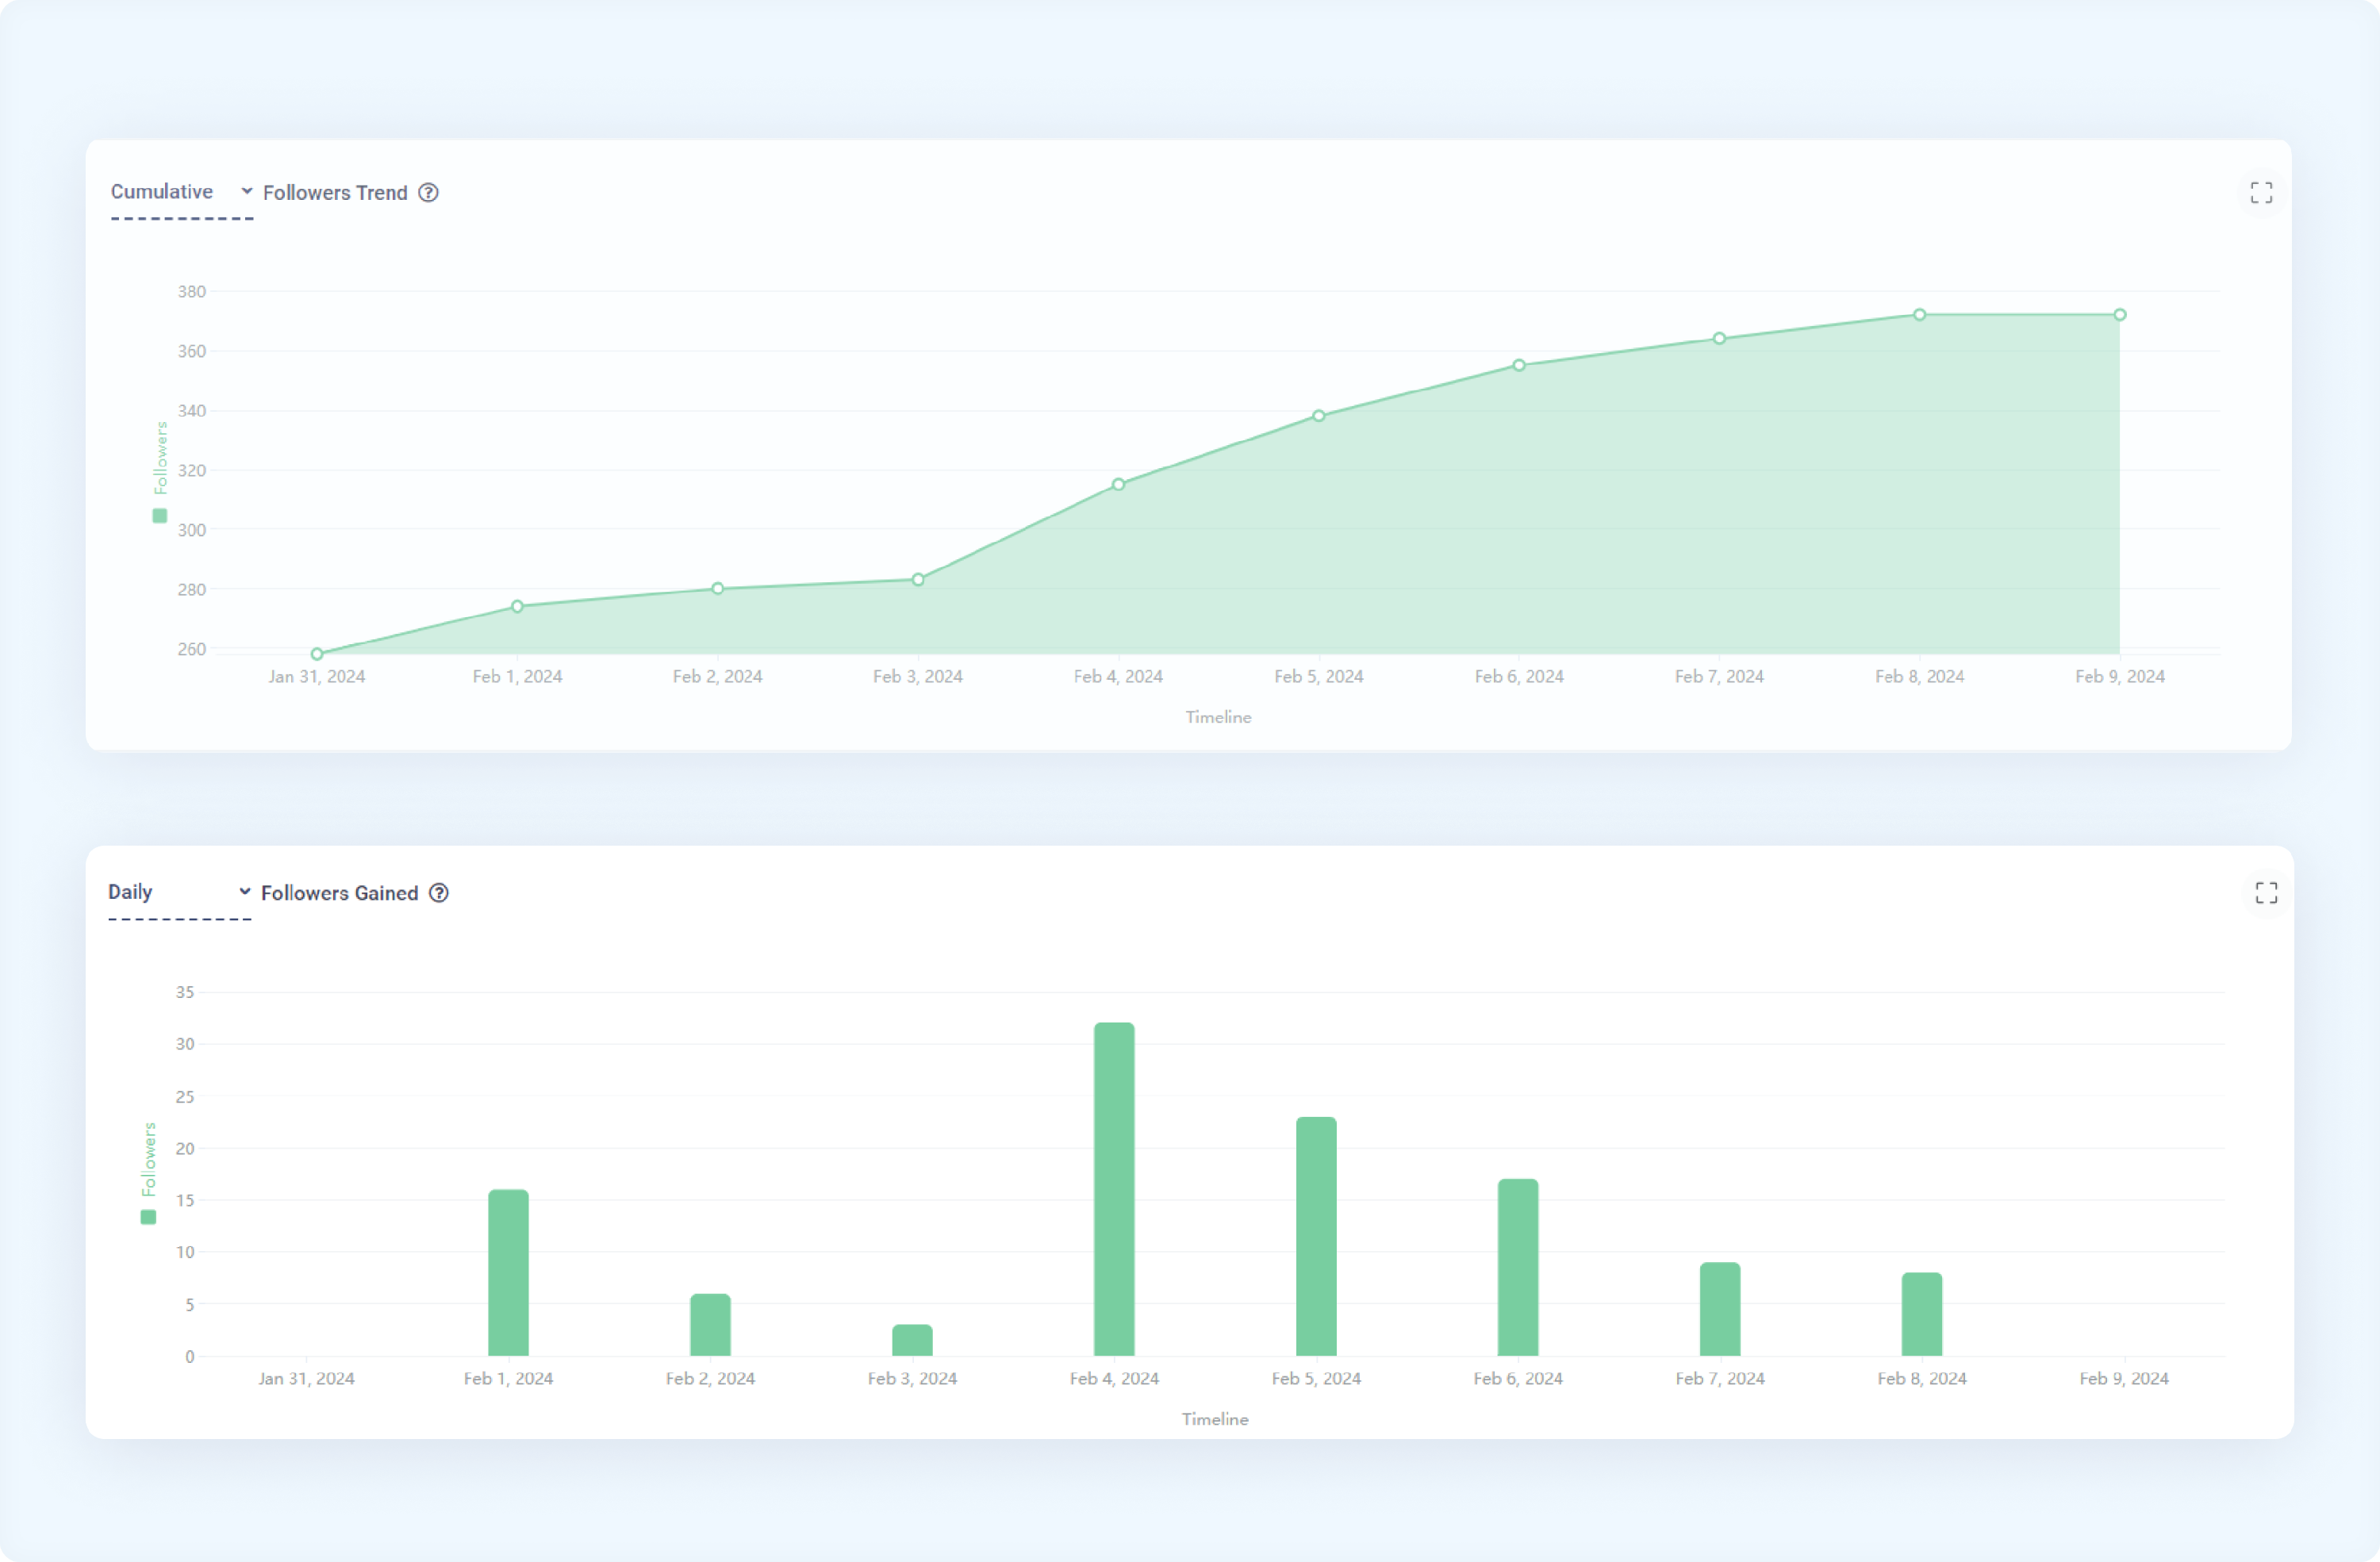
The graph has two views:
Cumulative Followers Trend: The graph examines the overall growth or decline in TikTok followers over time, aggregating daily changes to show a running total throughout the selected time period.
Daily Followers Gained: This graph shows the number of new followers gained on each specific day during the selected time period.
X-Axis: Date range
Y-Axis: Number of followers
✨Tip:
For more detailed view, you can expand graph using the expand icon on the top right corner of each graph and also can Zoom in and out for more detailed view.
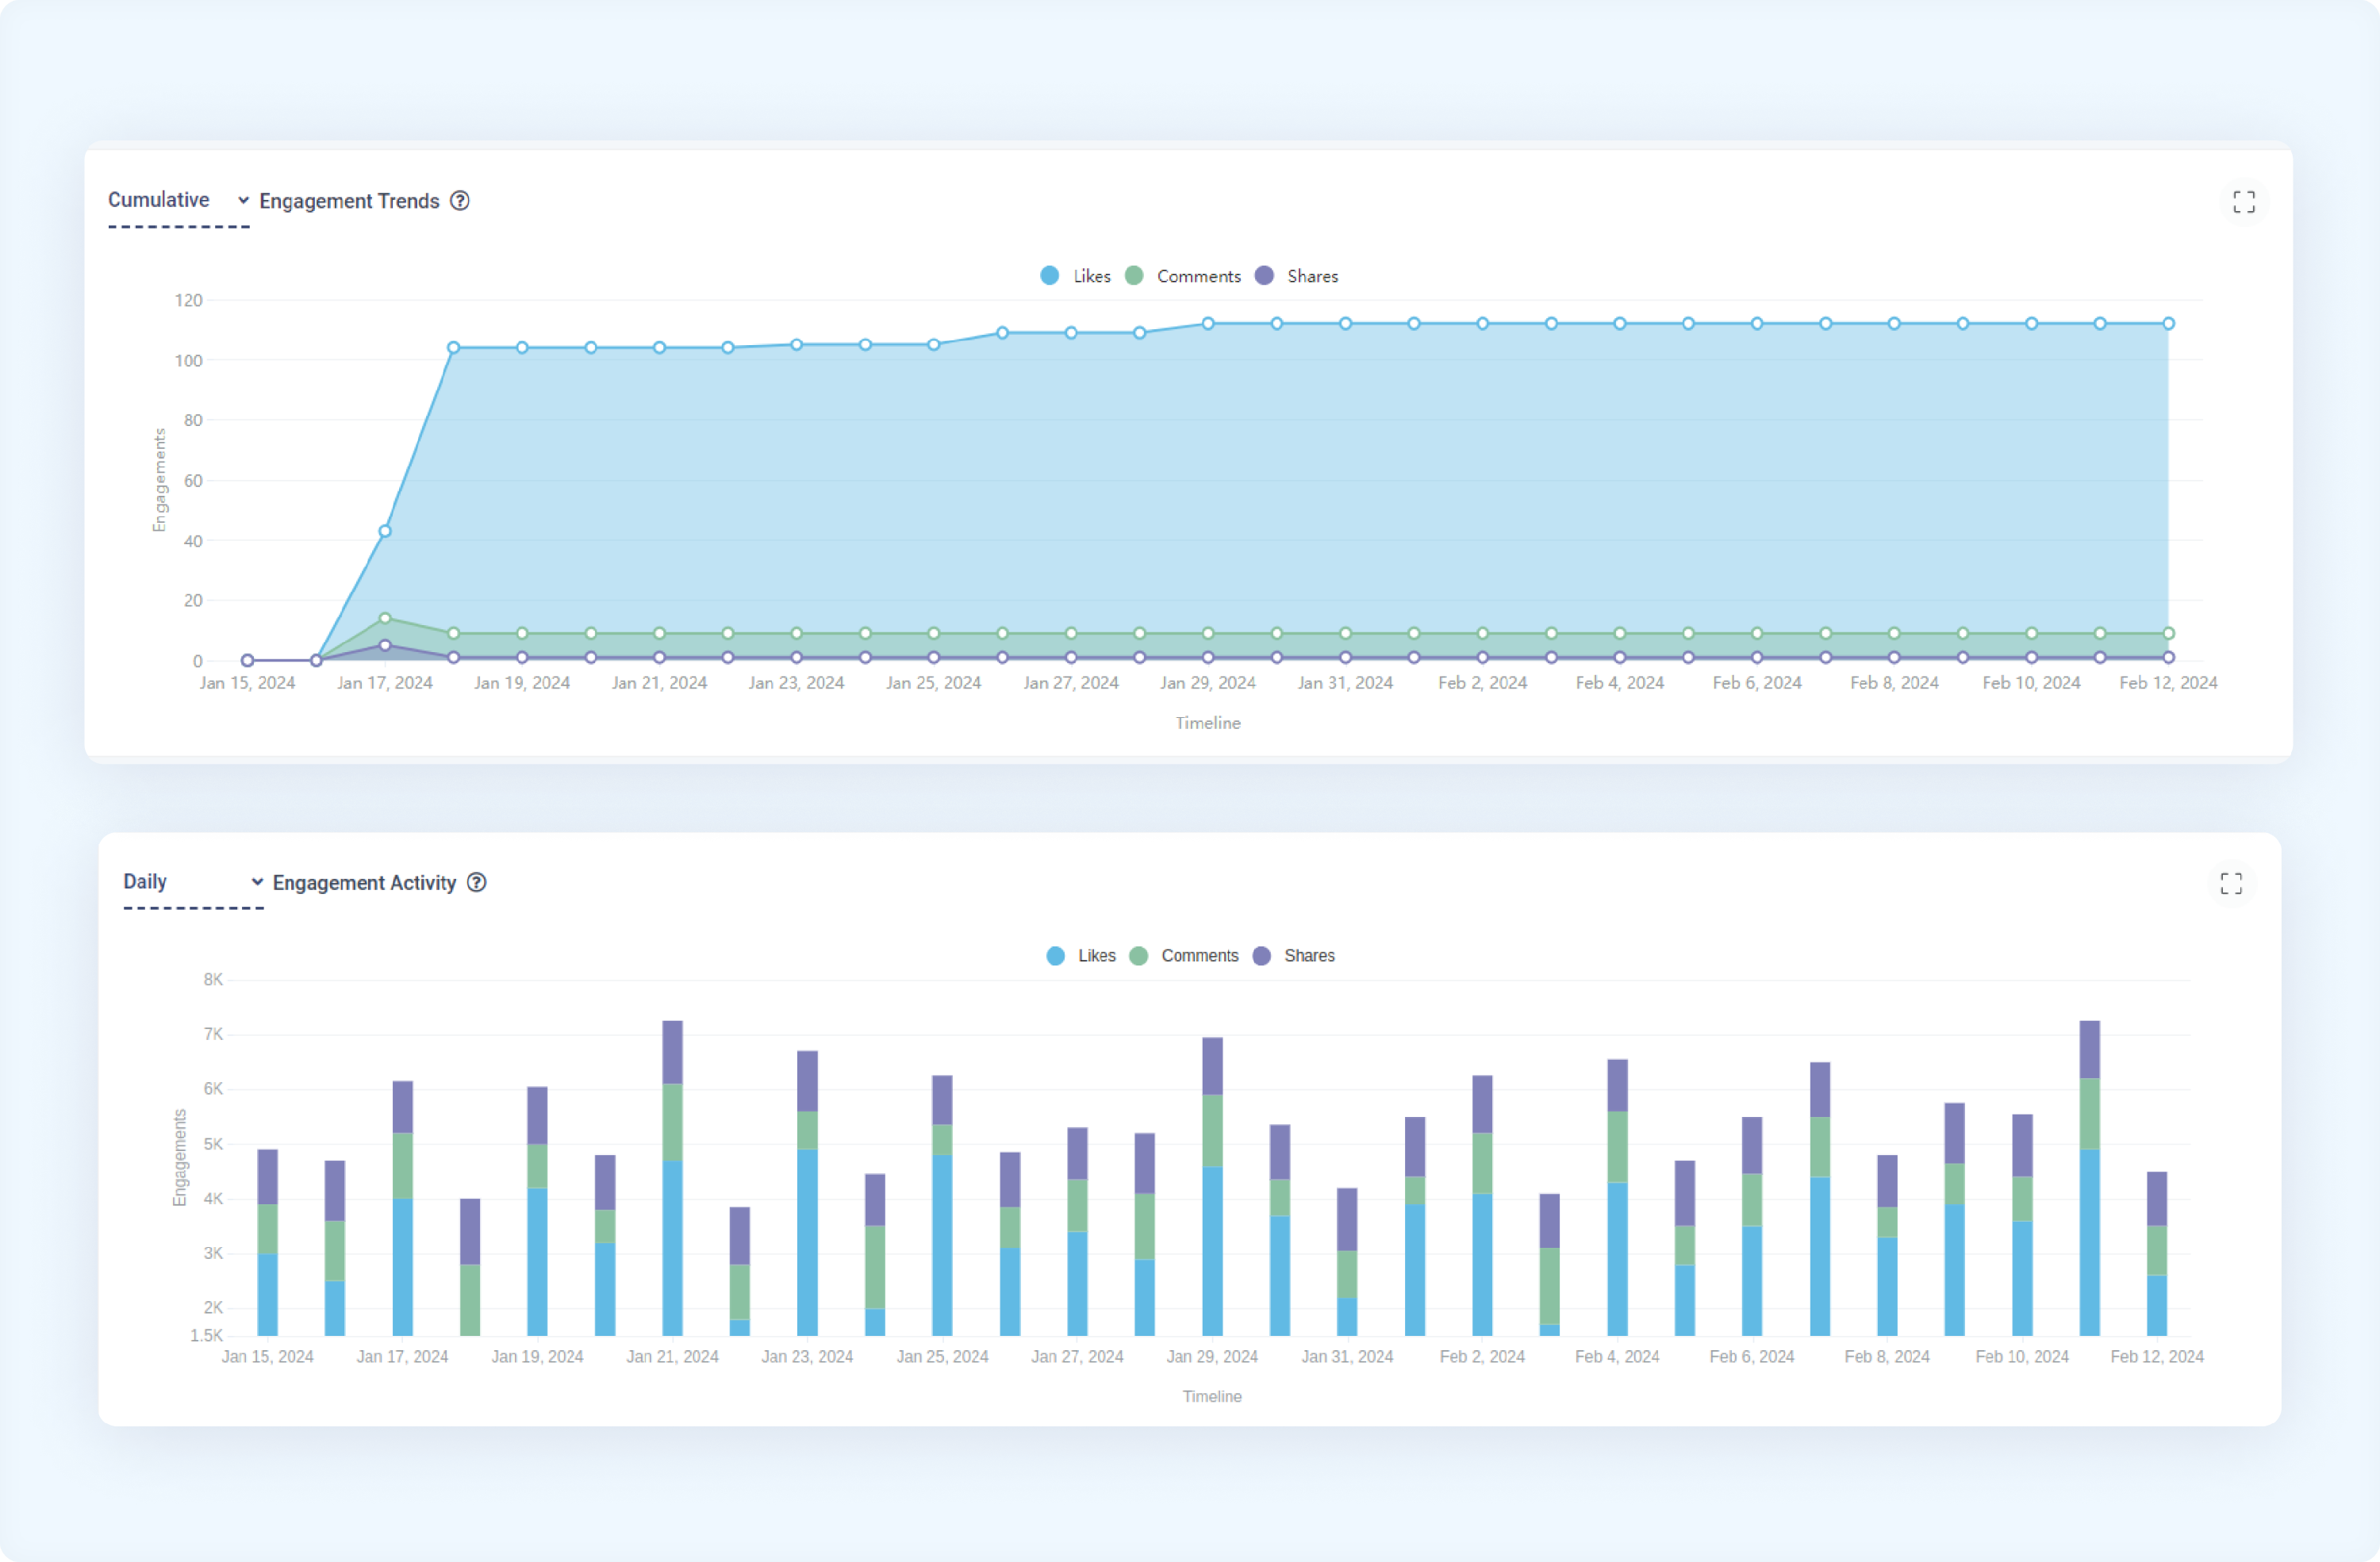
The graph has two views:
Cummulative Engagement Trends: Examine the overall growth in engagement metrics (likes, comments, and shares) throughout the selected time period, aggregating daily changes to show a running total, regardless of the post publication date.
Daily Engagement Activity: Inspect the day-to-day engagement metrics (likes, comments, and shares) received each day during the selected time period, regardless of the post-publication date.
X-Axis: Date range
Y-Axis: Number of Engagements
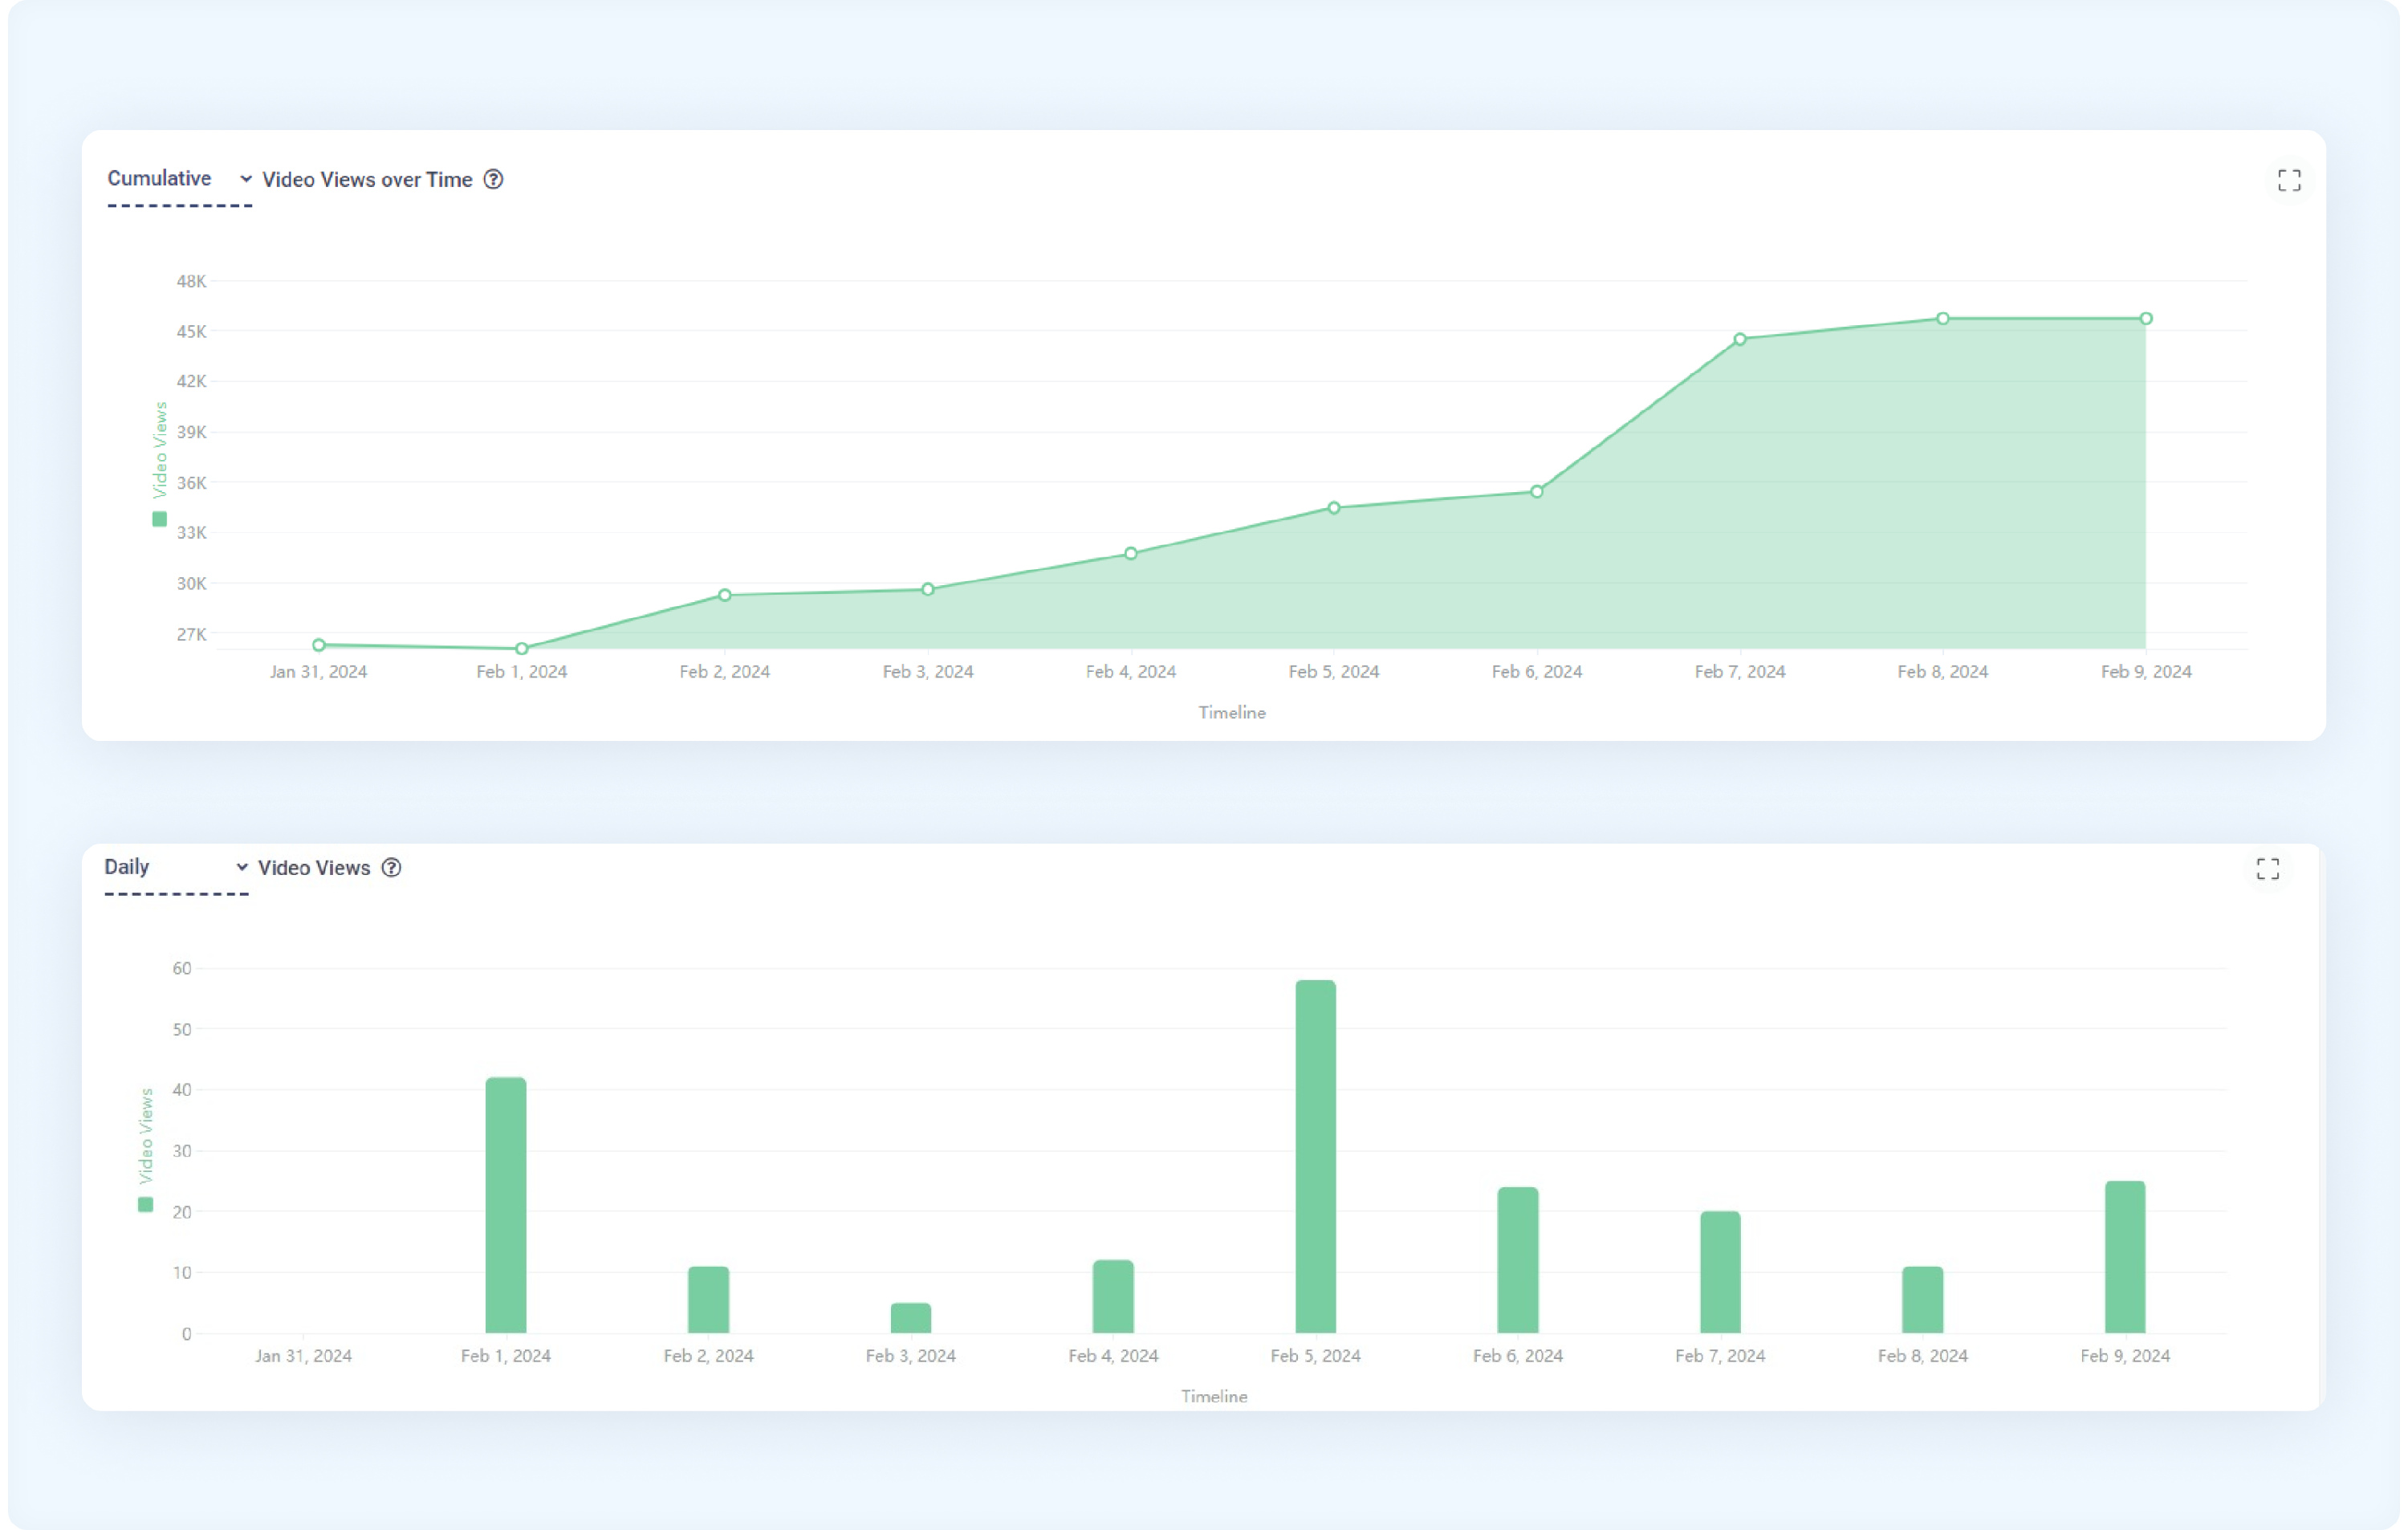
The graph has two views:
Cumulative Video Views over Time: Track the cumulative count of video views throughout the selected time period, aggregating daily changes to show a running total, regardless of the post publication date.
Daily Video Views: Analyze the day-to-day video views received each day during the selected time period, regardless of the post-publication date.
X-Axis: Date range
Y-Axis: Number of Video Views
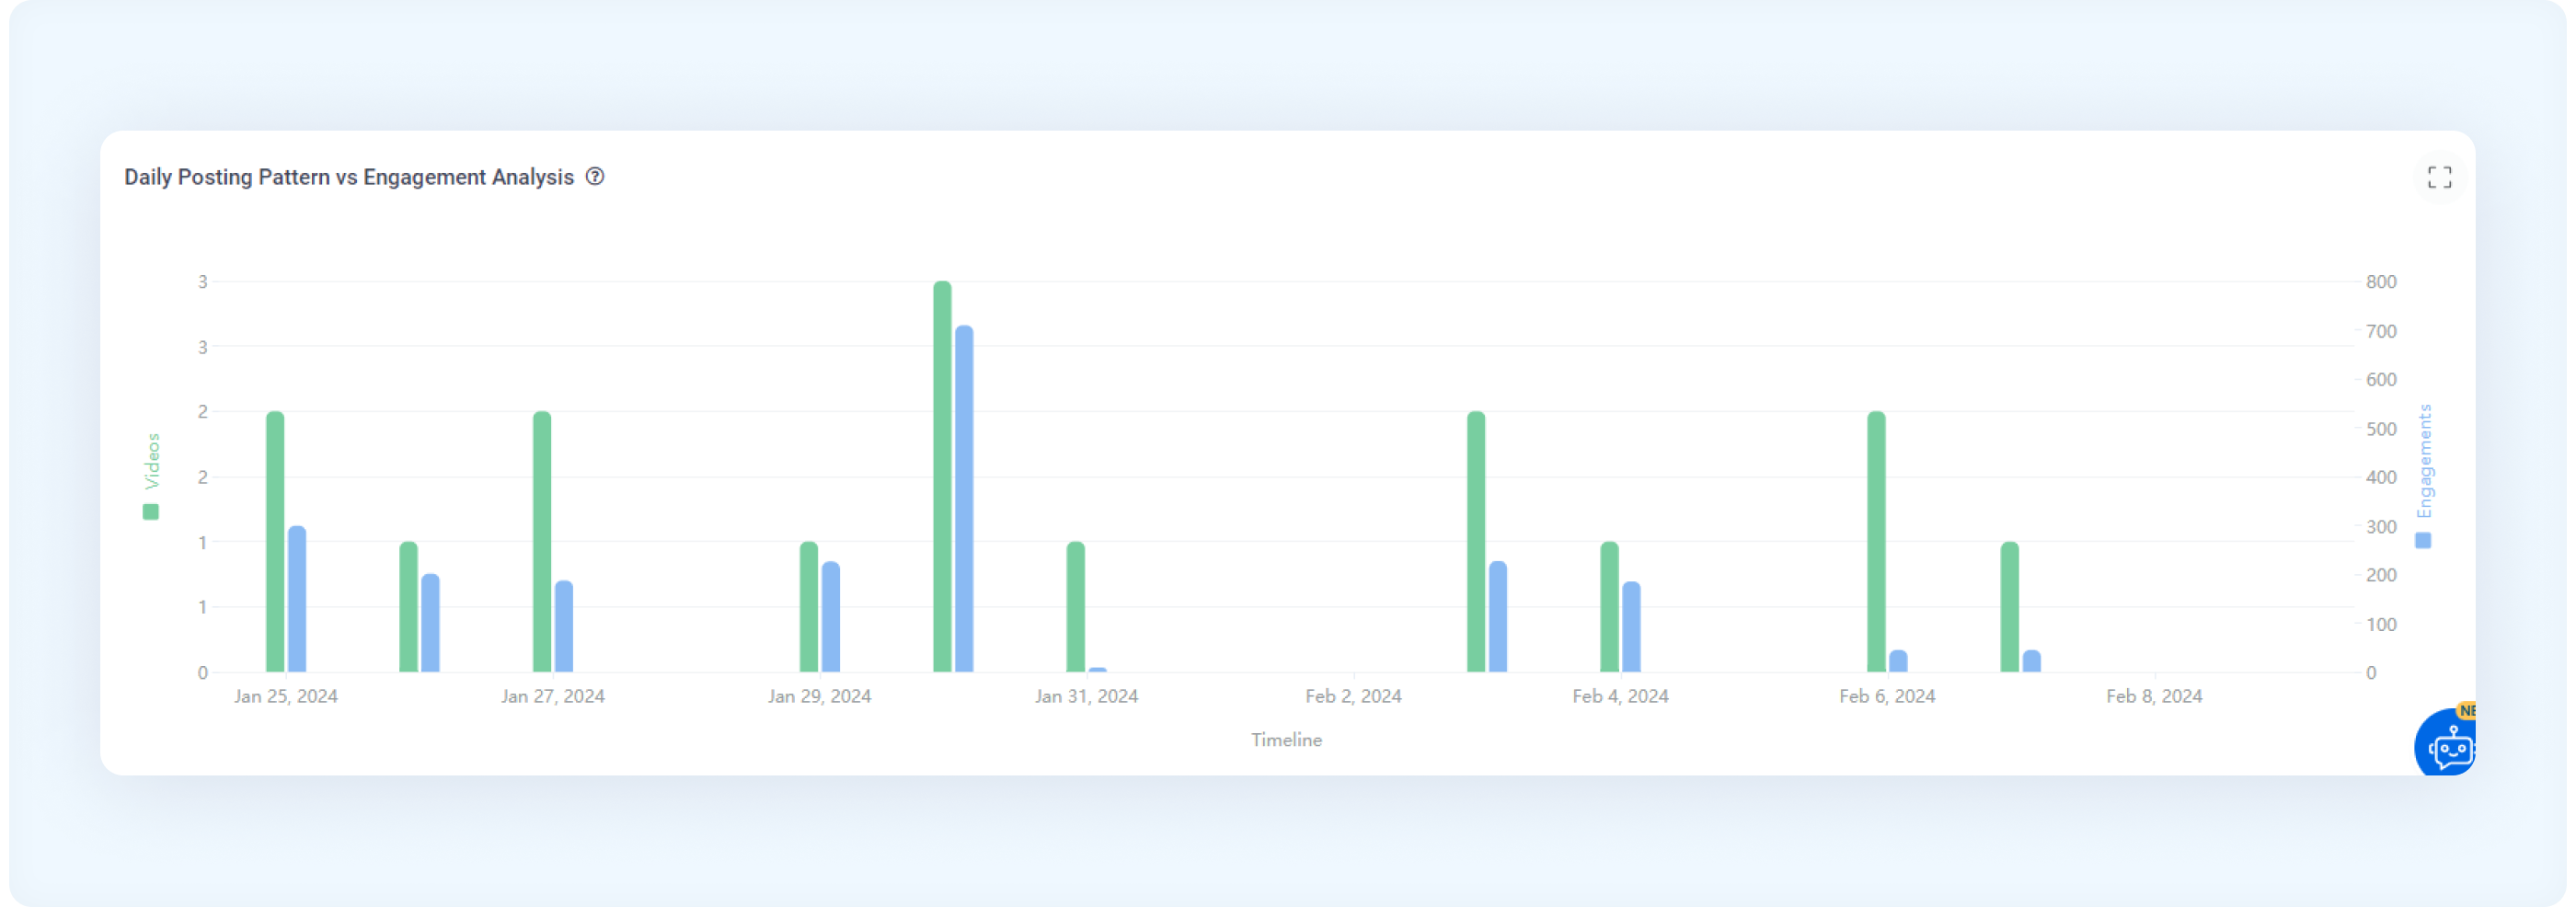
Assess the relationship between your daily posting frequency and subsequent engagement metrics over the selected time period.
This graph provides valuable insights into the impact of your posting frequency on key engagement metrics such as likes, comments, and shares. On the left side of the graph, it displays the number of videos, and on the right side, the total number of cumulative engagements, including all the likes, comments, and shares.
X-Axis: Date range
Y-Axis: Number of Videos and Engagements
This section showcases the most engaging and least engaging content published within the selected time period, providing a quick snapshot of your account's performance dynamics.
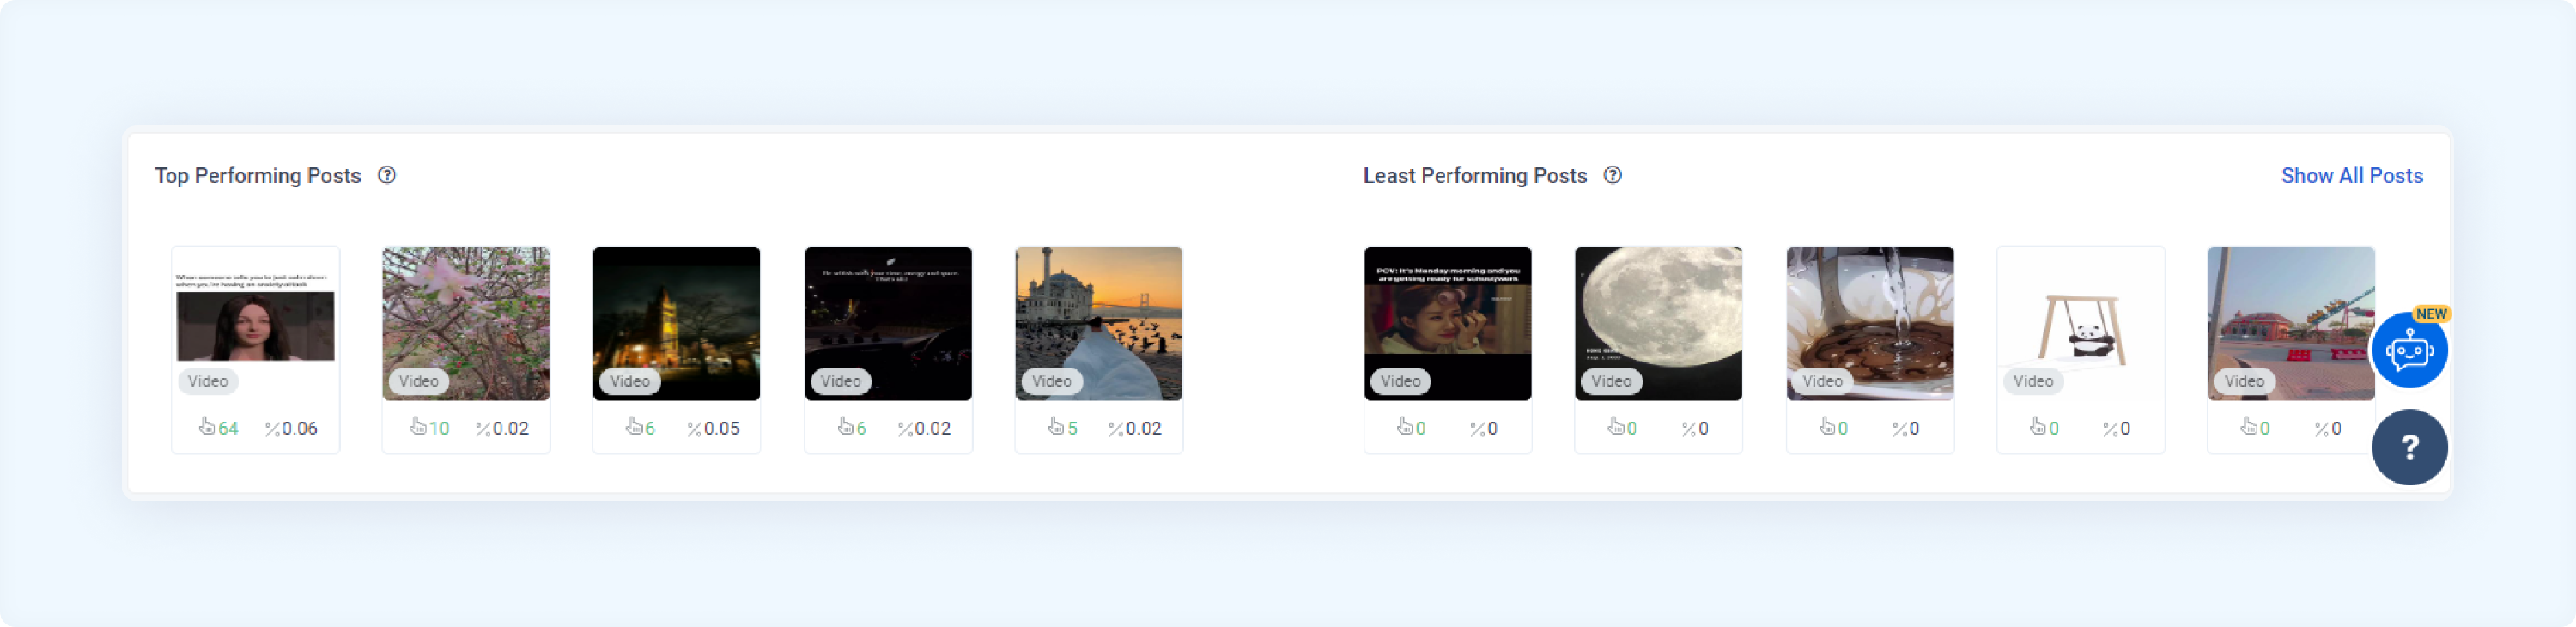
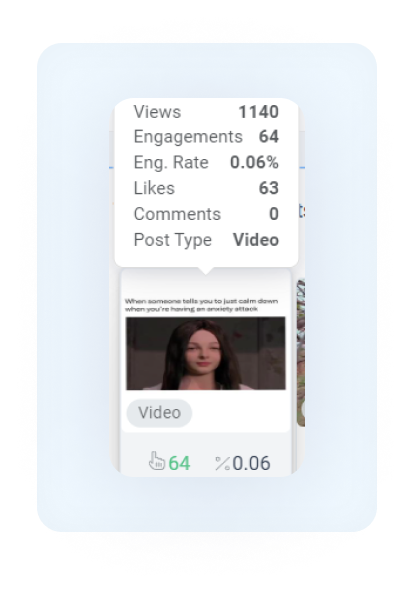
Hovering over each card displays the individual details like this:
Posts Tab
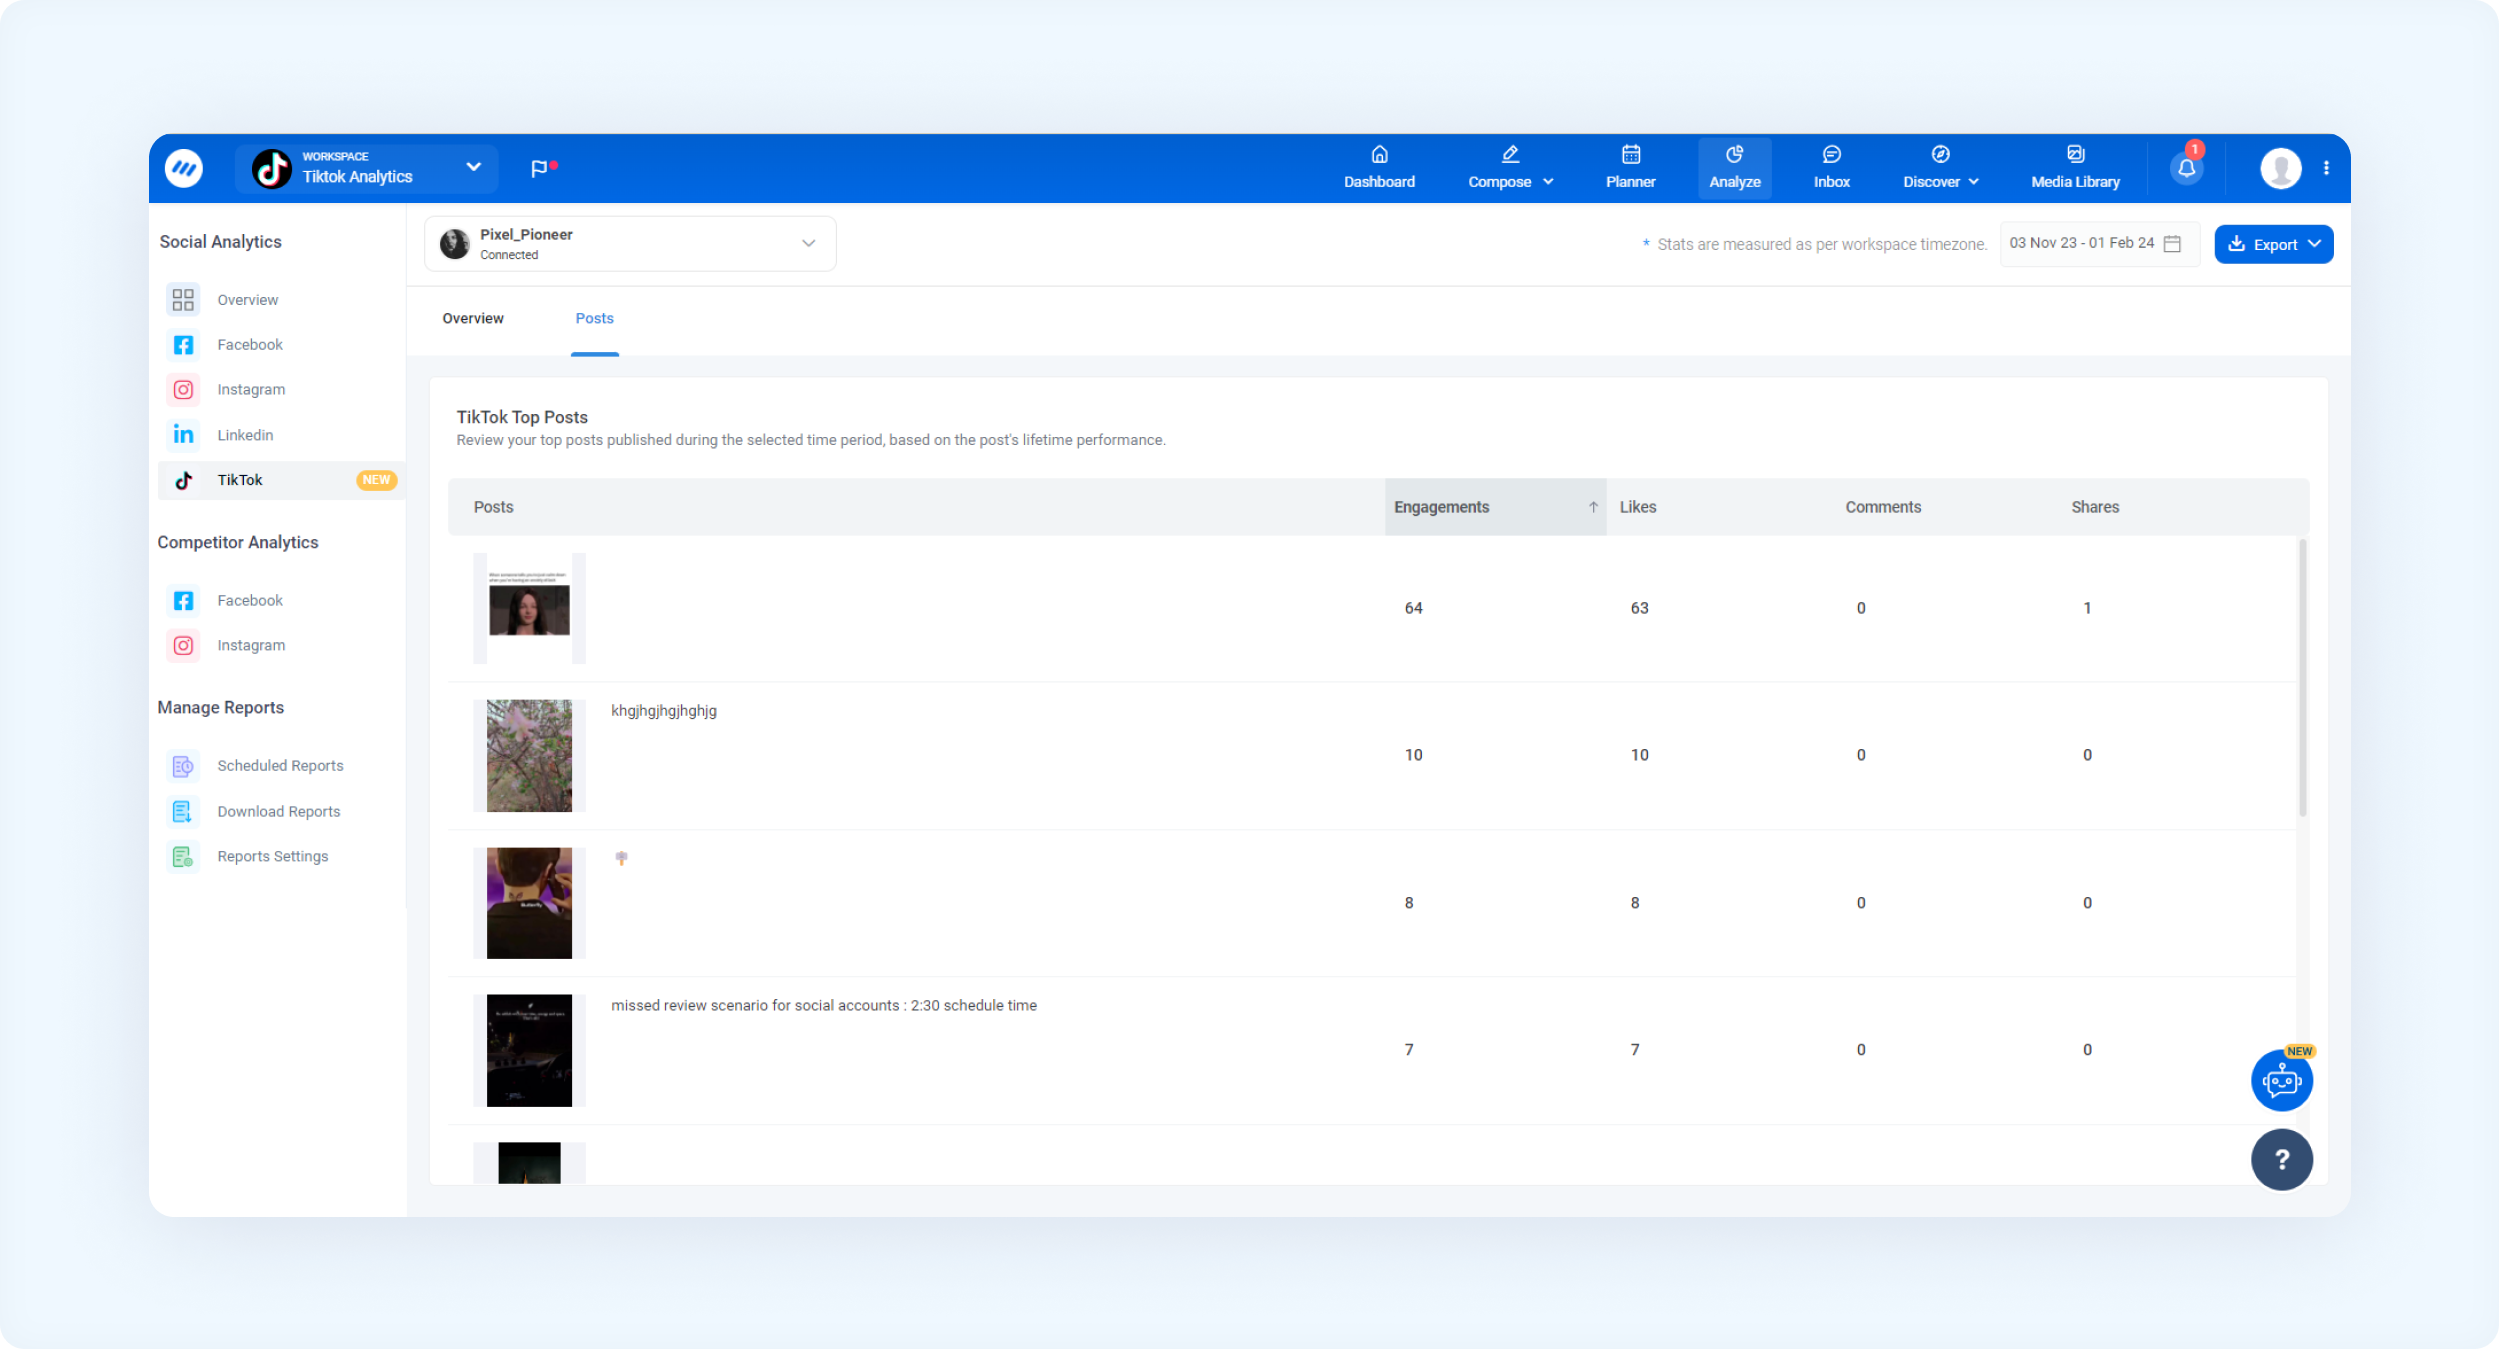
Now, let's swing over to the Posts Tab. This is where the minor details live. Here, you can dissect the performance of individual posts. View engagements, likes, comments, and shares of each post separately, and you can also sort the data in ascending and descending order using these metrics (engagements, likes, comments, and shares).
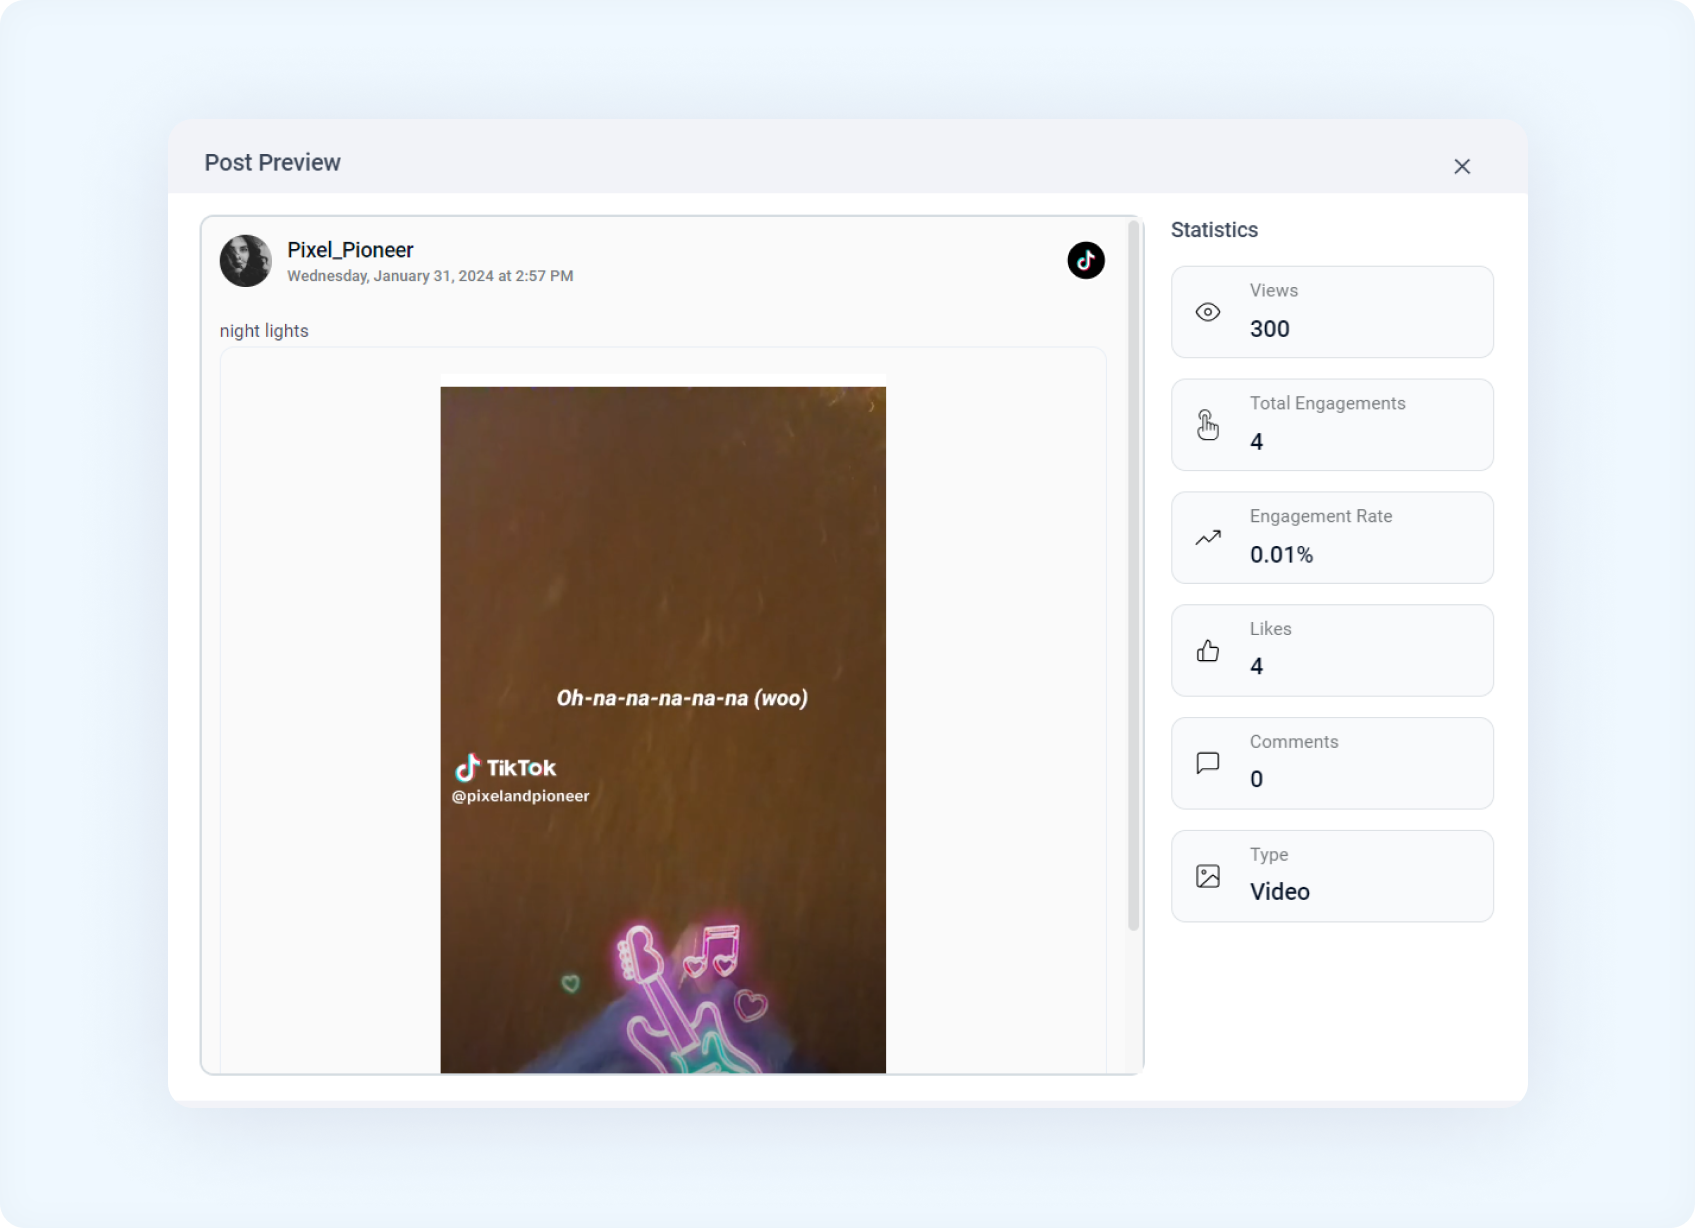
By clicking on the post, you can view more engagement details:
Save and Analyze Your TikTok Analytics
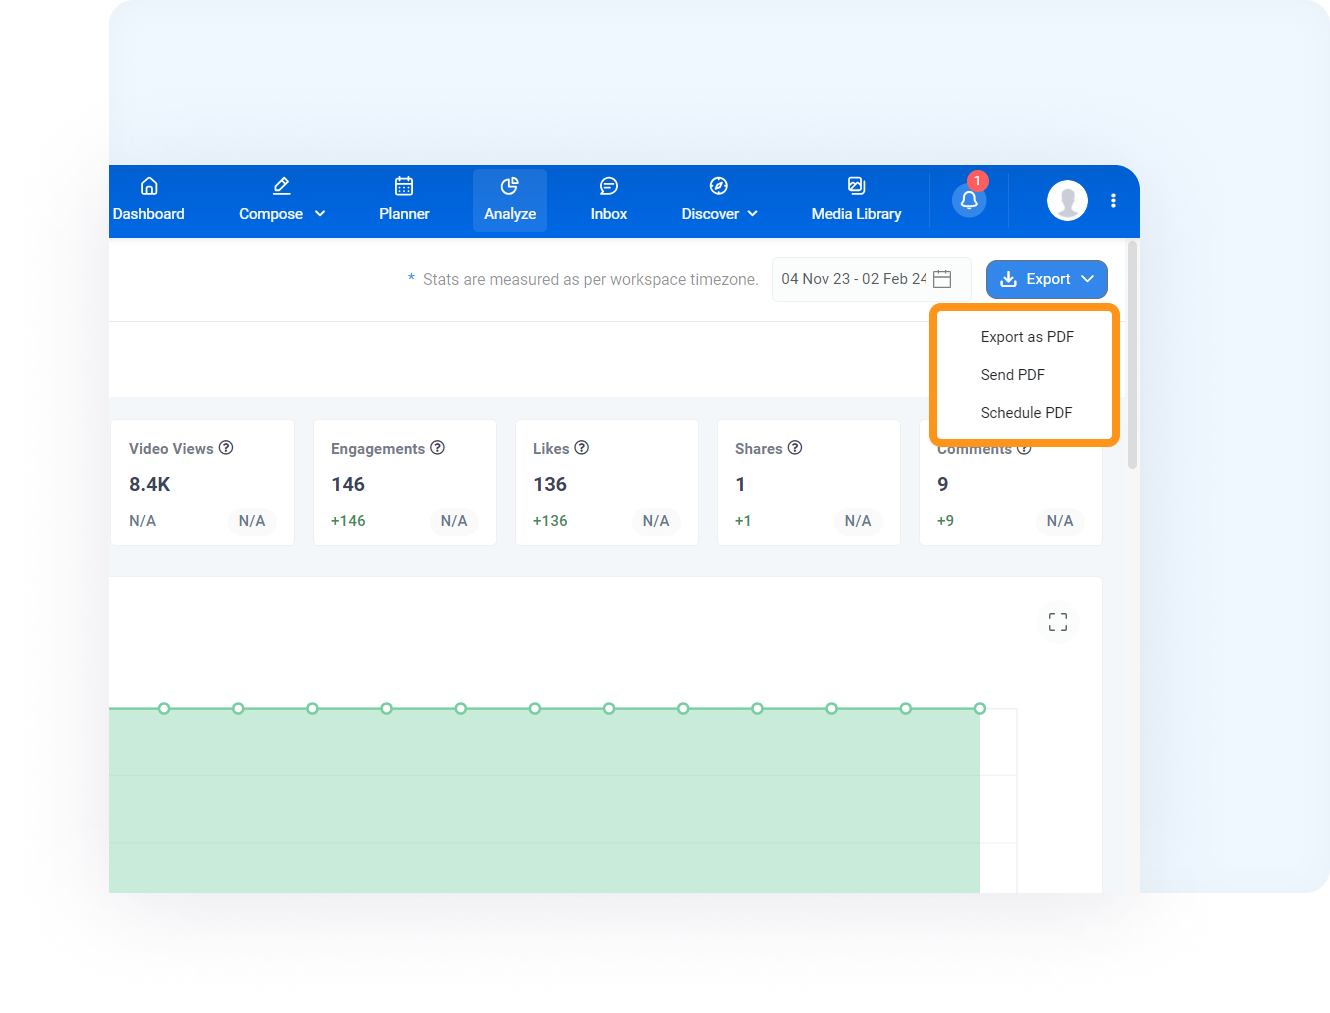
The Export button in the analytics dashboard provides a convenient way to extract and save your analytics data for further analysis or reporting.
By clicking on the export button, you can download a file containing a detailed breakdown of your TikTok performance metrics. You can:
Export as PDF
Send PDF
Schedule PDF
This is all about TikTok Analytics 💫
FAQs
Q1: What kind of data does TikTok Analytics provide?
A: TikTok Analytics provides data for public posts only. It does not provide privacy for posts marked “Private” or “Mutual follow friends.”
Q2: How often is the TikTok Analytics data updated?
A: TikTok data is fetched once a day.
Q3: Is there a limit to how far back I can view analytics data on TikTok?
A: The insights data starts the day you connect your account, and you'll see all the data for your posts right from the beginning.
Can I export TikTok Analytics data for further analysis?
Yes, you can export the TikTok Analytics data using the export button. For more details, read Save and Analyze Your TikTok Analytics
Can I access TikTok Analytics for multiple TikTok accounts?
Users are only able to access the data of TikTok accounts that are connected to ContentStudio.
Was this article helpful?