

Threads Analytics
ContentStudio now supports analytics for Threads, giving you a complete breakdown of how your Threads account is performing — all from the same Analytics dashboard you already use for your other social channels. Track your followers and follower demographics, profile views, link clicks, engagement, posting patterns, top-performing posts, hashtags and topic tags, without switching between platforms.
Reconnect your Threads account first
Threads analytics needs a permission that earlier connections did not include. If you connected your Threads account before analytics was available, the dashboard shows a prompt asking you to reconnect, and stays empty until you do.
Reconnecting takes a few seconds and does not affect your scheduled or published posts — publishing keeps working either way.
Your follower history starts on the day you connect. Threads reports only your current follower count and provides no past figures to any tool, so the follower chart begins at your first sync and fills in from there.
[Screenshot: the reconnect prompt on the Threads dashboard]
How to Access Threads Analytics
Here's how to navigate to your Threads Analytics dashboard inside ContentStudio.
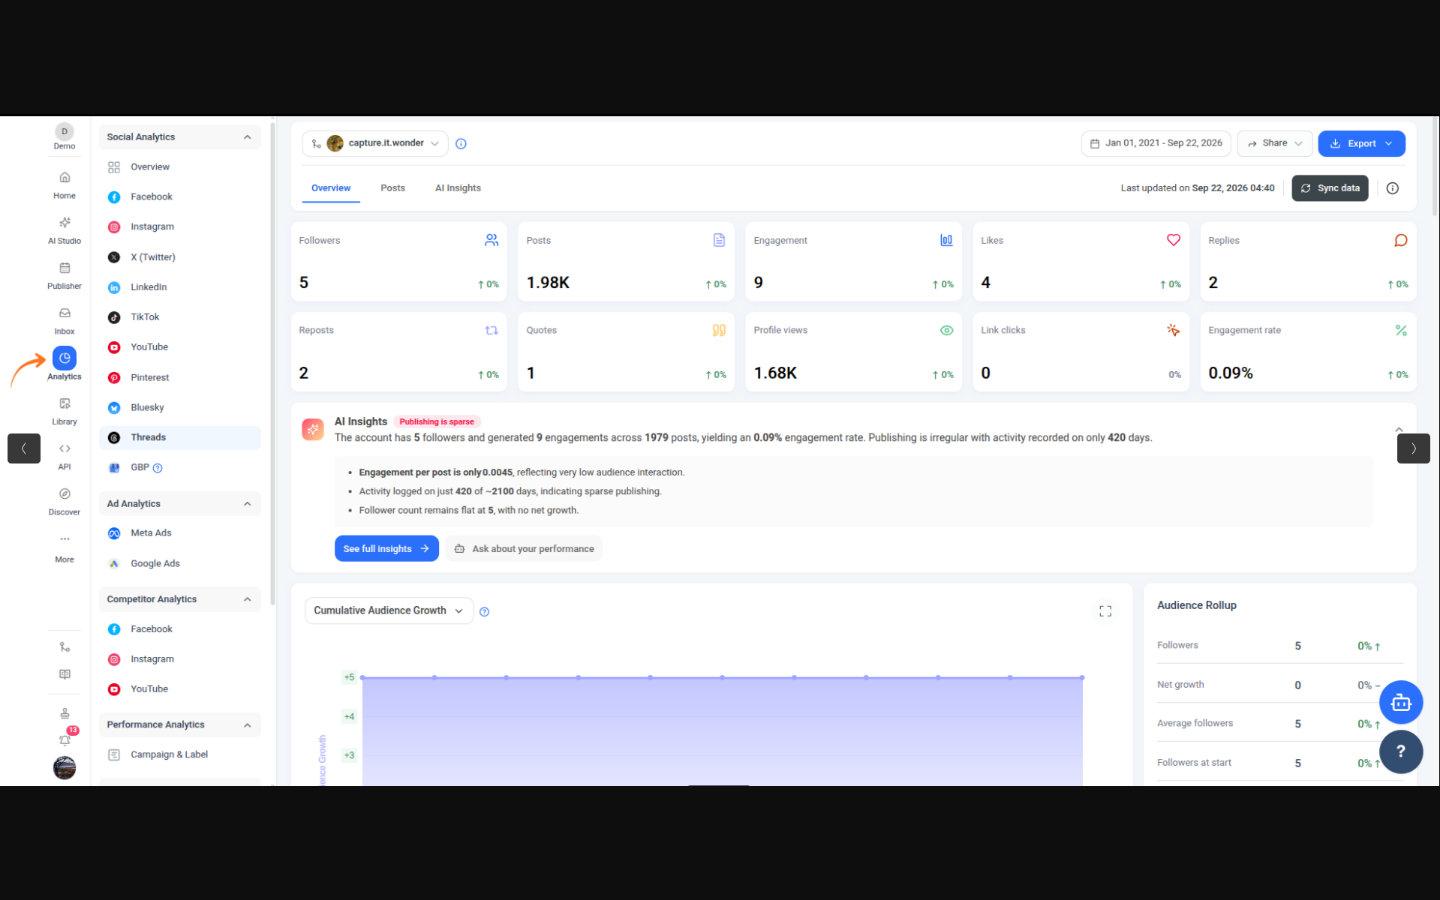
Use the account selector at the top of the dashboard to switch between connected Threads accounts, and Sync data to pull the latest numbers at any time.
Selecting a Date Range
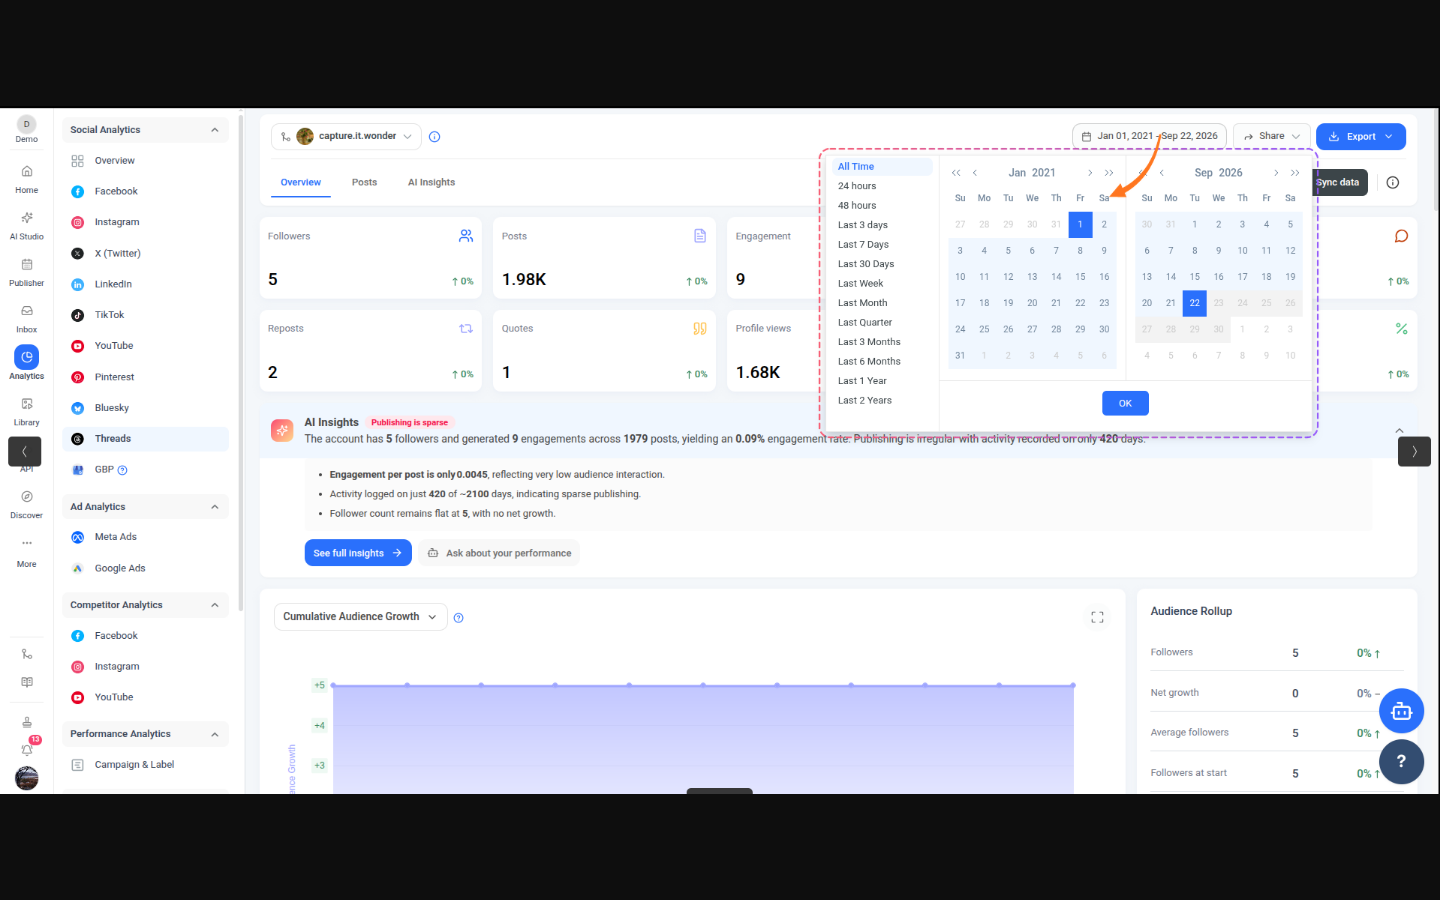
Click the date range selector in the top-right corner to adjust the reporting period. Available presets include:
- All Time
- 24 Hours / 48 Hours / Last 3 Days
- Last 7 Days / Last 30 Days
- Last Week / Last Month / Last Quarter
- Last 3 Months / Last 6 Months
- Last 1 Year / Last 2 Years
You can also pick a custom date range using the calendar pickers and click OK to apply.
Threads holds no account statistics from before 13 April 2024, so a range that reaches further back simply has no data in the earlier days — including All Time.
Overview Tab
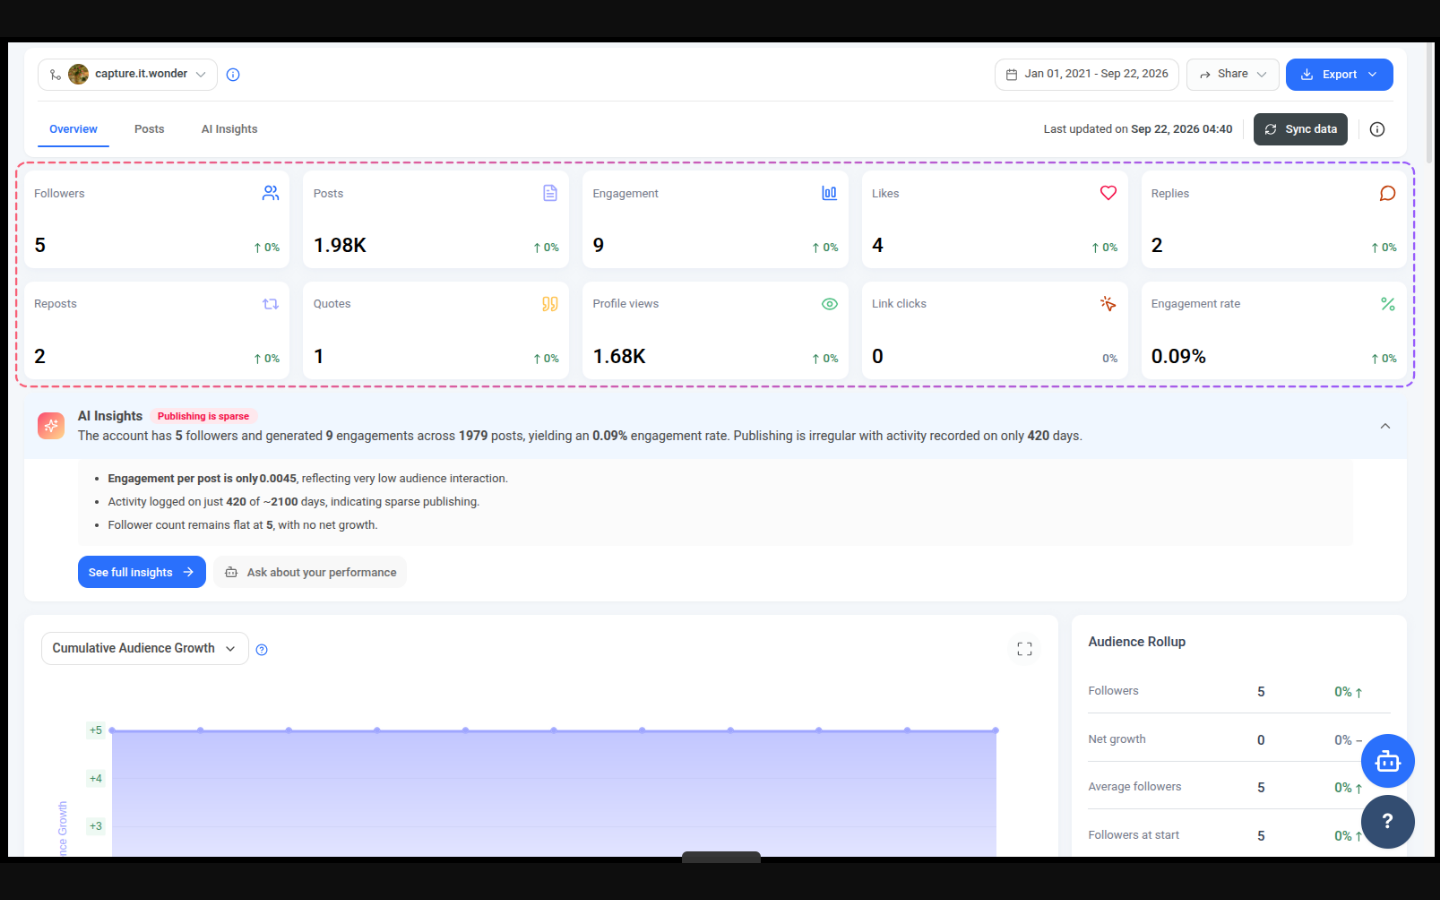
The Overview tab provides a high-level snapshot of your Threads account's performance, including how your audience and your content are doing across the selected period.
Key Metrics
At the top of the Overview tab you'll see a set of metric cards showing your most important numbers at a glance. Each card also shows the percentage change compared to the previous period.
- Followers — Your current follower total.
- Posts — Posts you published during the selected period. Reposts of other accounts are counted but carry no engagement, because Threads reports none for them.
- Engagement — Likes, replies, reposts and quotes added together, on the posts published in this period.
- Likes — Likes on those posts.
- Replies — Replies to those posts. Threads counts top-level replies only.
- Reposts — Times your posts were reposted.
- Quotes — Times your posts were quoted. Threads counts quote posts separately from reposts, so they are shown on their own.
- Profile views — How often people opened your profile during the period. This is not how many times your posts were seen.
- Link clicks — Clicks on links in your posts.
- Engagement rate — Engagement divided by your follower count, as a percentage.
AI Insights
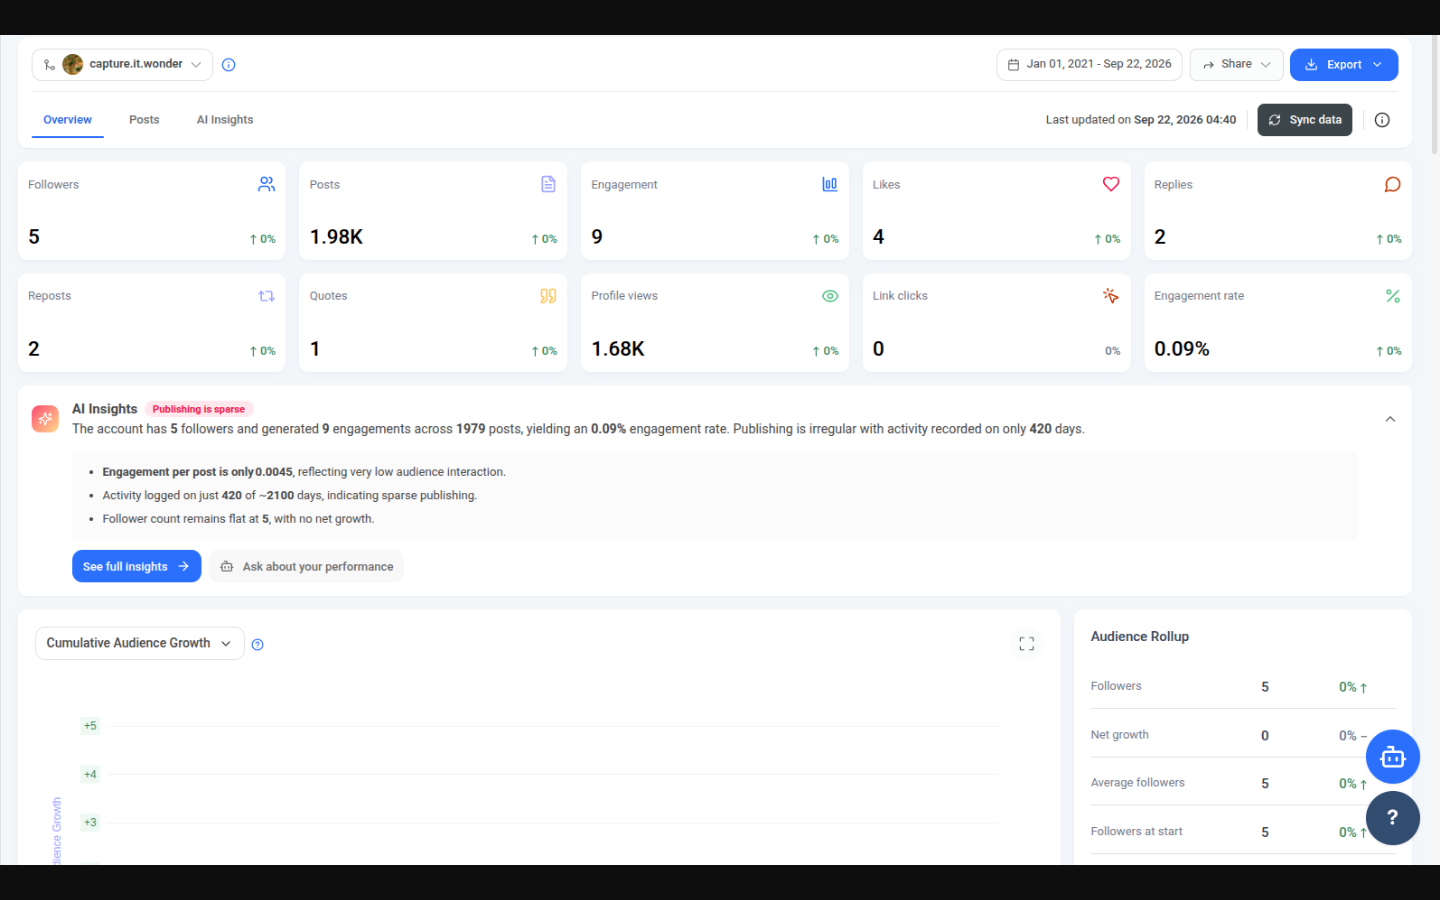
The AI Insights card sits below the key metric cards. It reads your account data for the selected period and generates a summary of trends, observations and recommendations.
Click the expand arrow for the full read-out, or open the AI Insights tab for the detailed version. If there isn't enough activity in the period, you'll see a message saying so rather than an invented summary.
Audience Growth
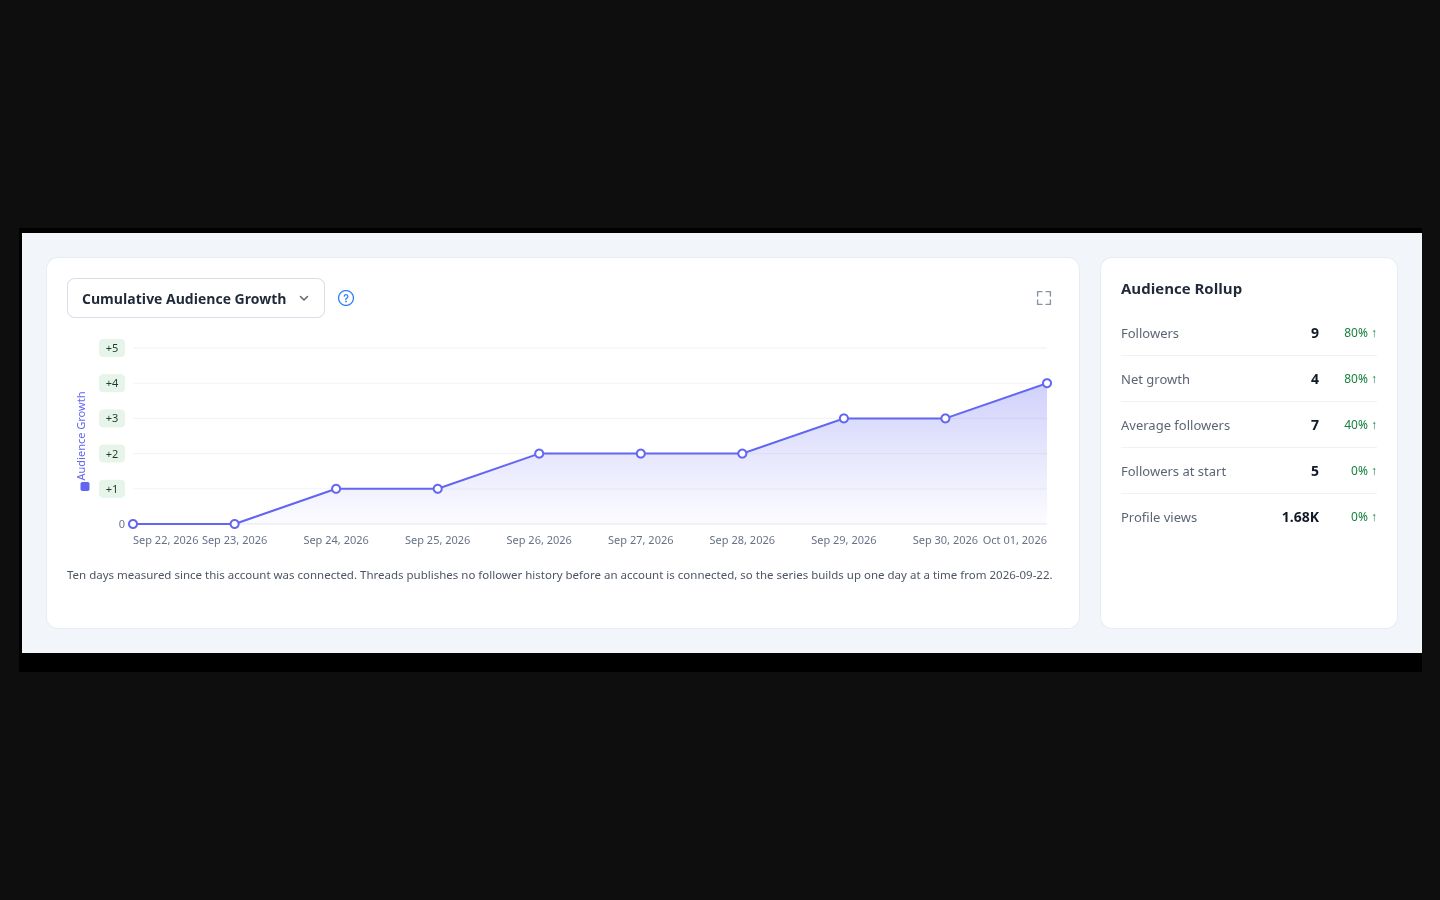
This chart shows your follower total on each day we recorded a snapshot, and the day-over-day change. Use the dropdown above the chart to switch between the cumulative total and the daily change.
Days before the account was connected appear as gaps rather than zeros — Threads publishes no follower history, so those days were never measured. If only one day has been recorded so far, the chart says so instead of drawing a flat line.
The Audience Rollup panel on the right summarises:
- Followers — Follower total at the end of the period.
- Net growth — Change between the first and last snapshot in the period. Negative if the account lost followers.
- Average followers — Mean daily follower count across the days that have snapshots.
- Followers at start — Follower total on the first day of the period with a snapshot.
Account Activity
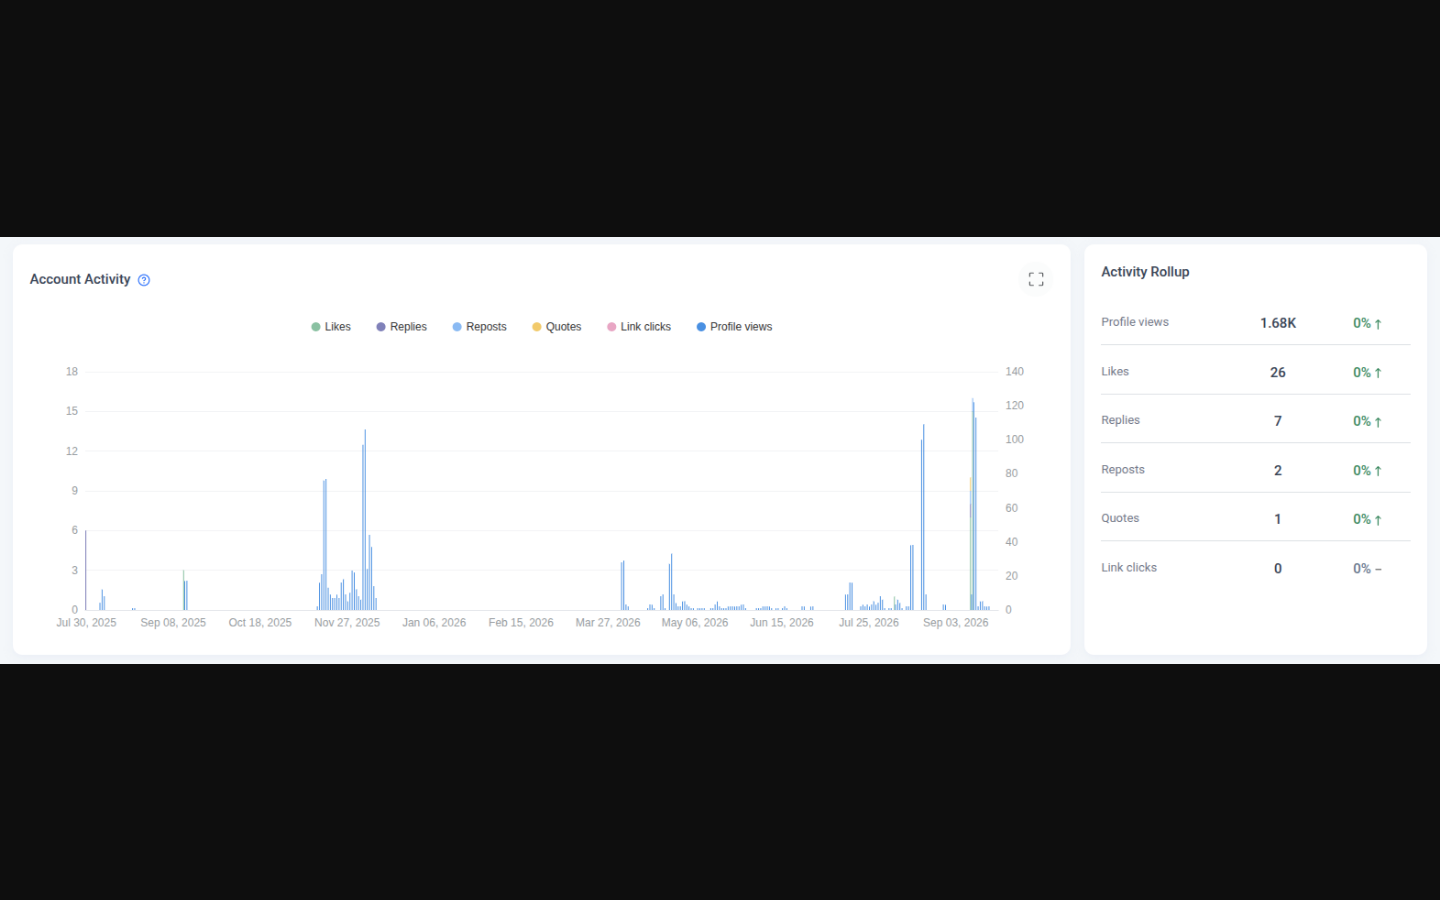
This is the one chart that reports what happened on each day, across your whole account: likes, replies, reposts, quotes, link clicks and profile views, day by day. These are the only genuinely per-day figures Threads publishes.
Days before the account was connected are not counted, and the chart tells you how many days in your range it could measure.
The Activity Rollup panel on the right summarises profile views, link clicks, likes, replies, reposts and quotes for the period.
Engagement
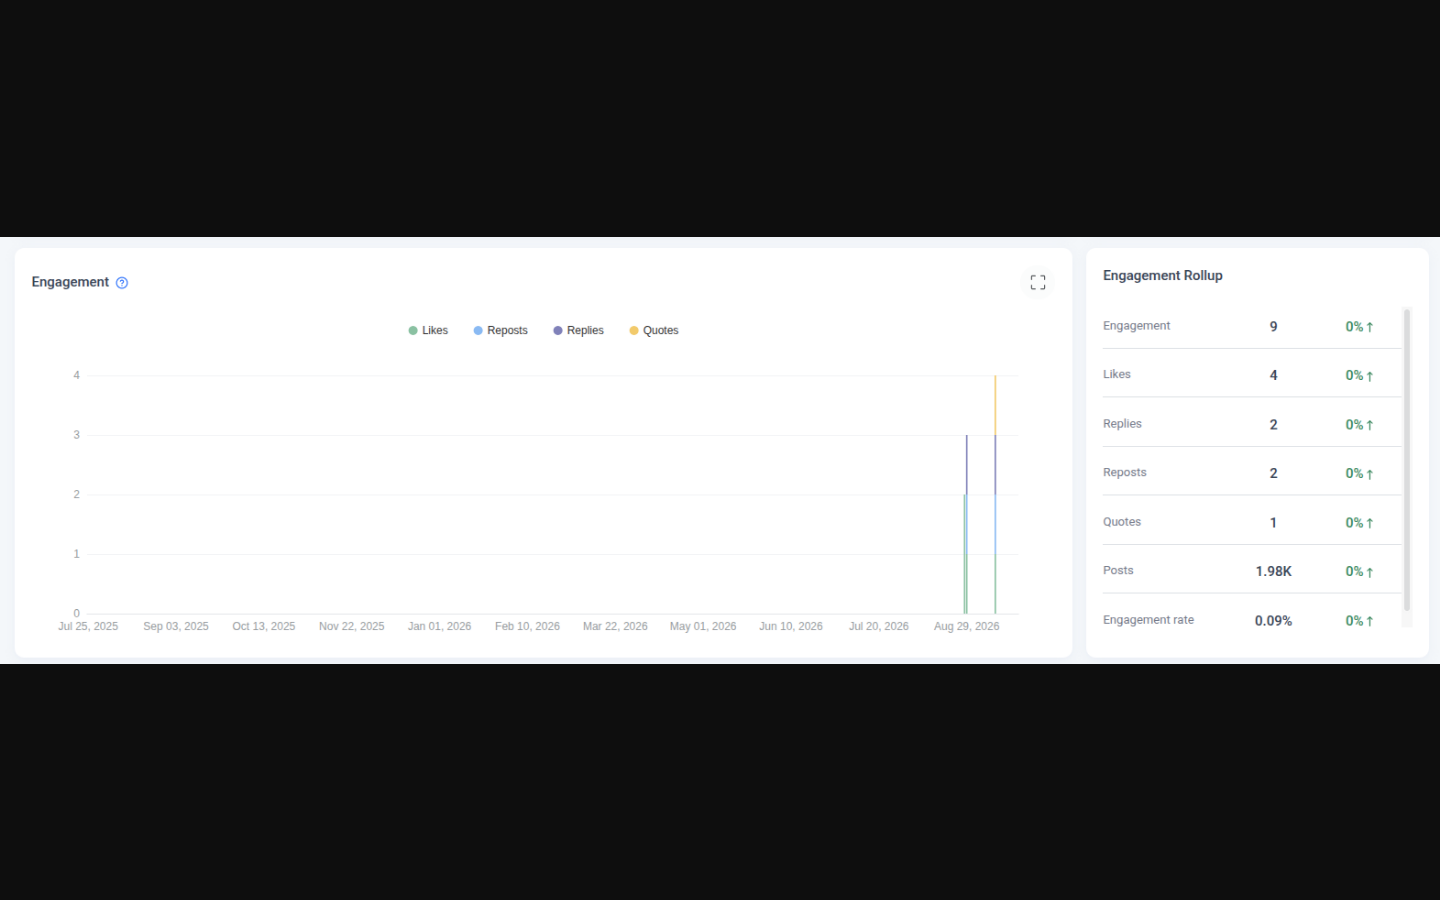
This chart groups engagement by the day each post was published, measured at the last sync — which is a different question from Account Activity above. Threads post counters are lifetime totals, so each bar is the engagement a day's posts have earned in total, not the interactions that occurred that day.
Hover over any point to see the exact value. The Engagement Rollup panel on the right shows Engagement, Likes, Replies, Reposts, Quotes, Posts and Engagement rate for the period.
Engagement vs Publishing Behaviour
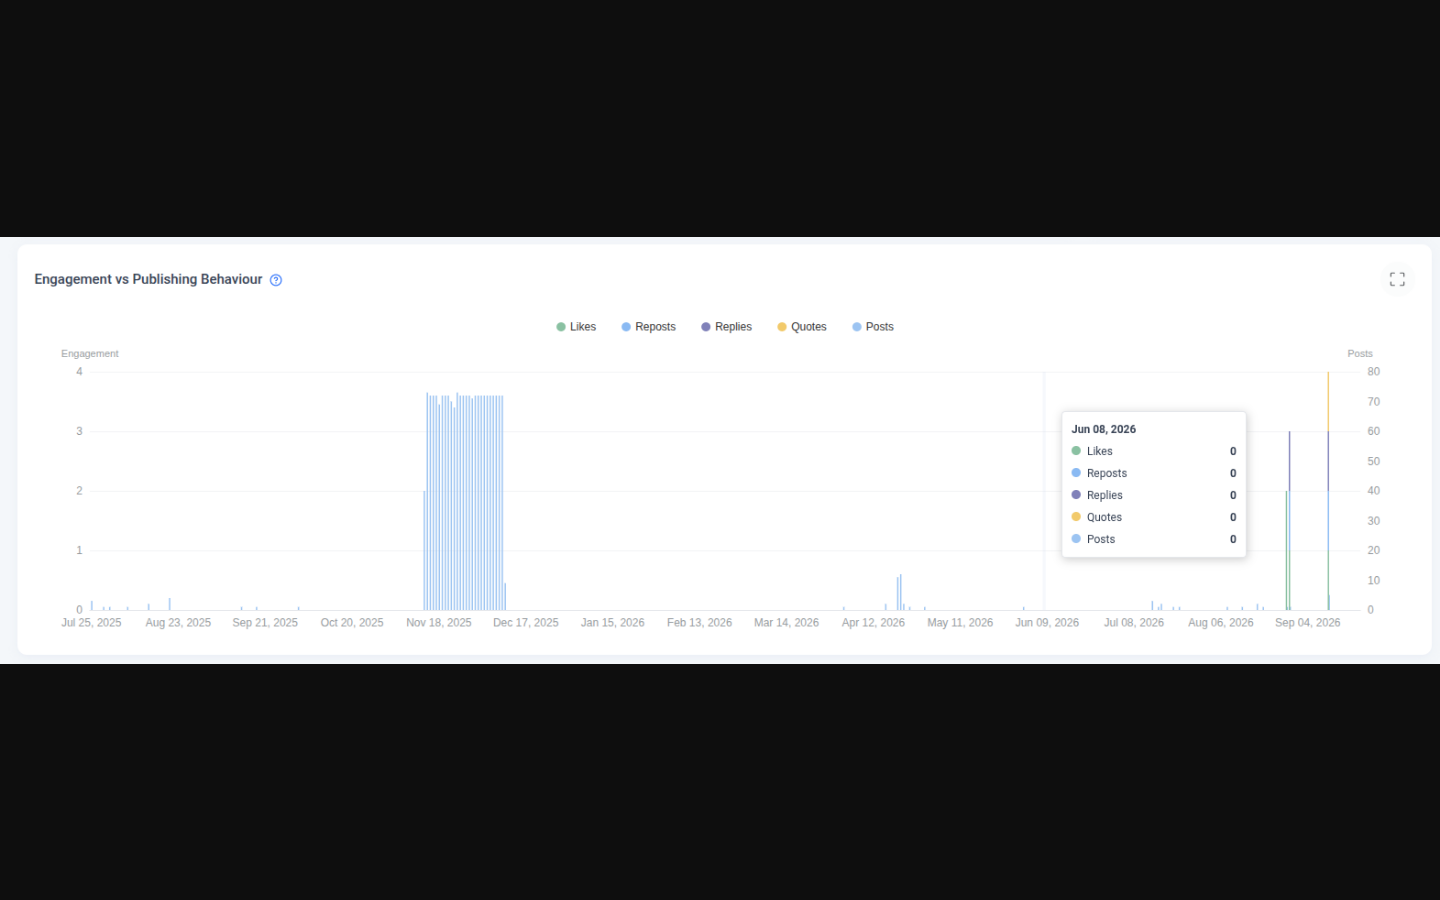
This chart sets your posting volume against the engagement those posts earned, so you can see whether busier periods actually bring more interaction.
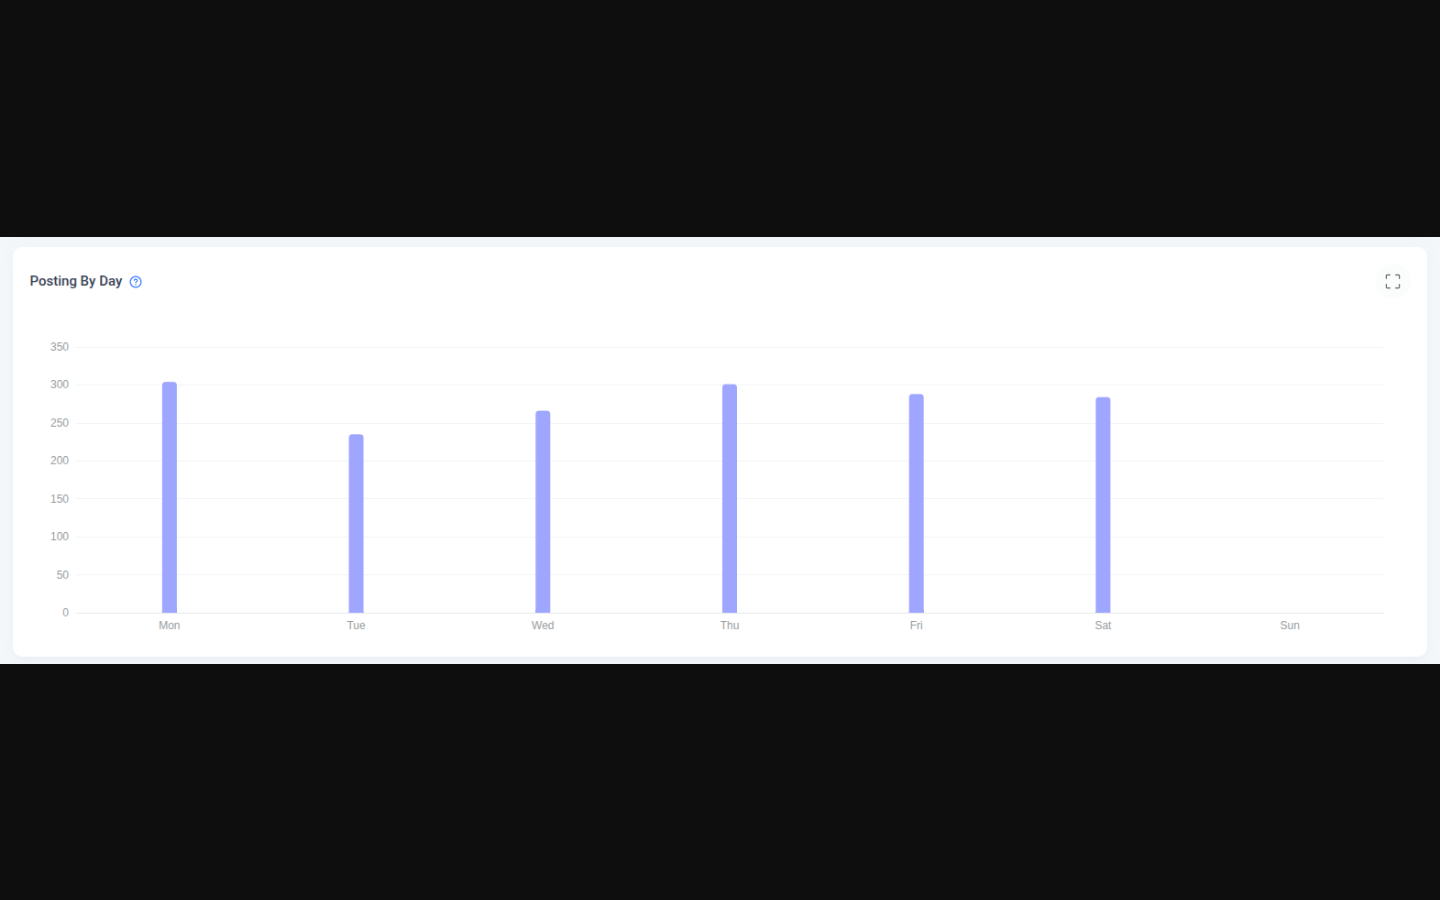
Posting by Day
Shows how many posts you published on each weekday during the period, in your workspace's time zone. Use it to see which days you're most active on and plan your schedule accordingly.
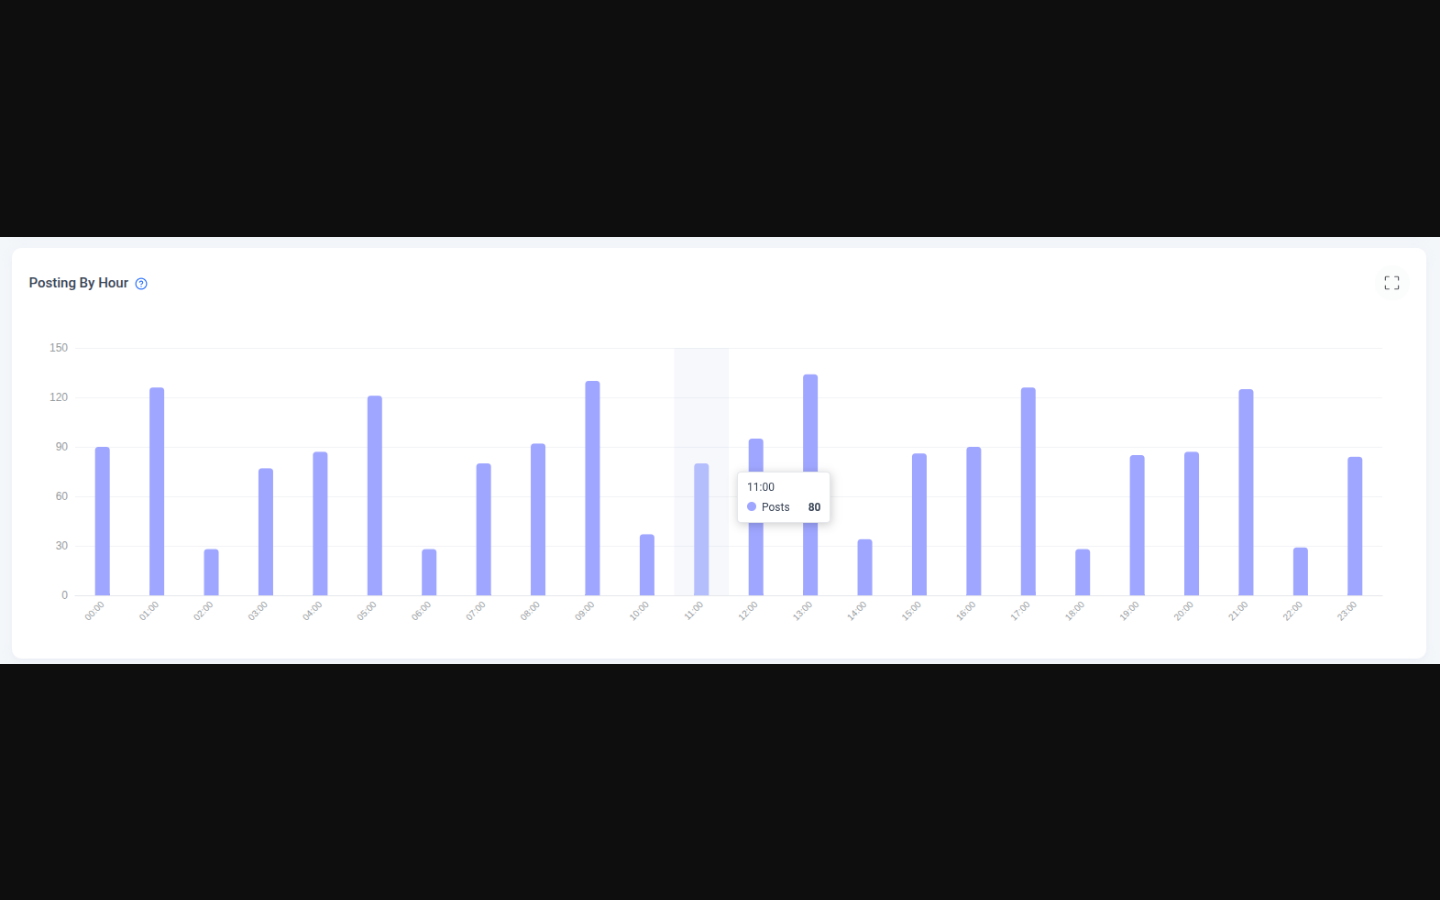
Posting by Hour
Breaks your posting activity down by hour of the day, in your workspace's time zone. Use it to see when this account actually posts, and pair it with Engagement to judge whether those hours are the ones earning interactions.
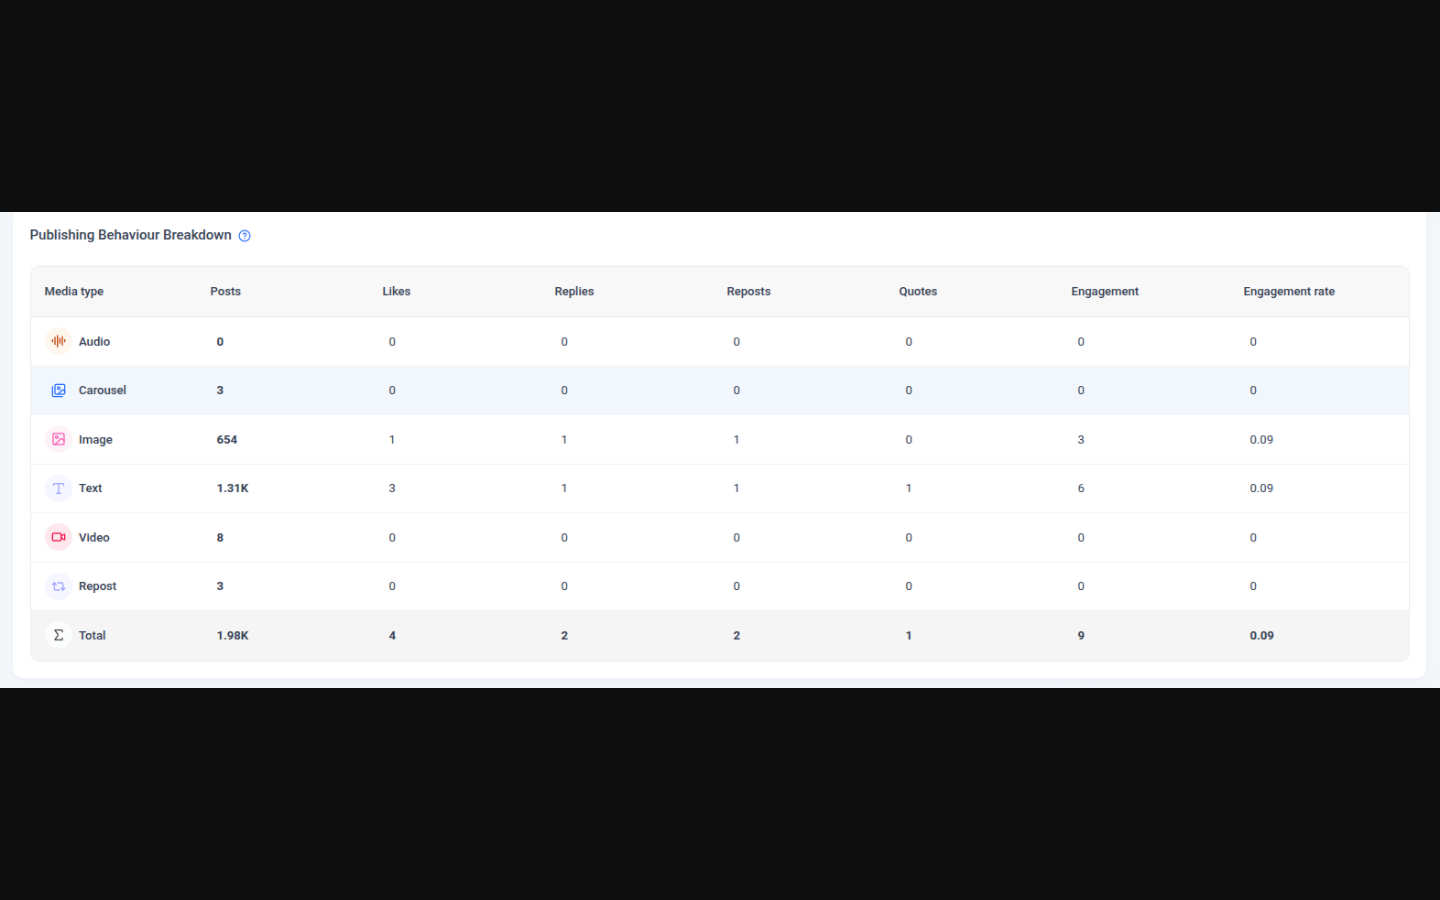
Publishing Behaviour Breakdown
This table breaks your posting activity down by post type, so you can see which formats perform best:
- Text — Posts with no media.
- Image — Posts with a single image.
- Video — Posts containing a video.
- Carousel — Posts with multiple images or videos.
- Audio — Posts containing audio.
- Repost — Reposts of another account's post.
Each row shows Posts, Likes, Replies, Reposts, Quotes, total Engagement and Engagement rate for that type. Reposts of other people's posts appear with no figures rather than with zeros, because Threads reports no metrics for them.
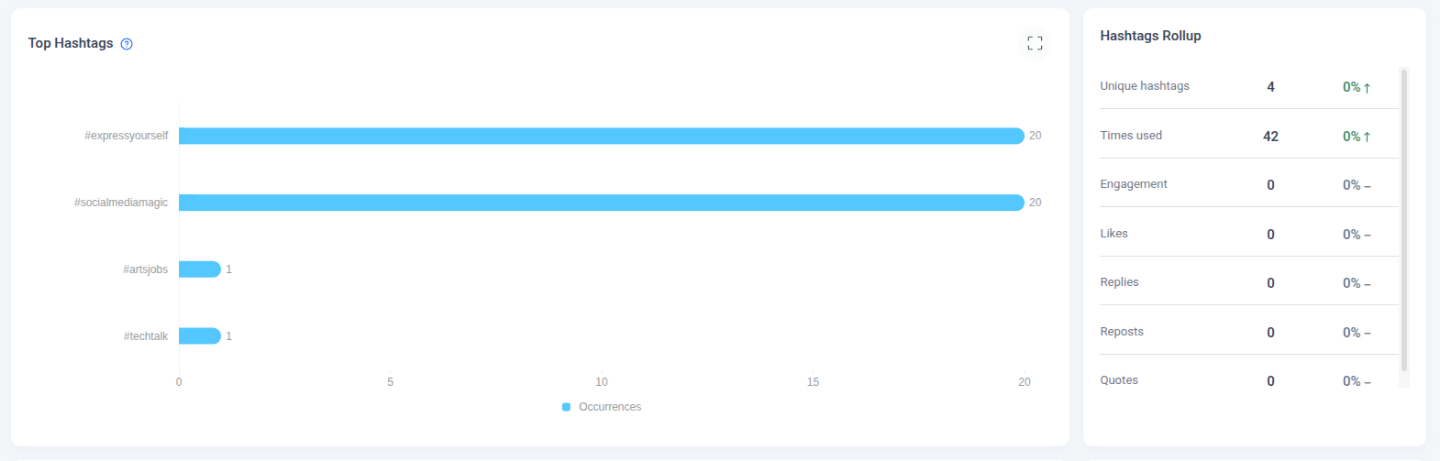
Top Hashtags
Your most-used hashtags — the ones you type into a post — ranked by the engagement those posts earned. Tags are shown in lowercase so one tag isn't split across different capitalisations.
The Hashtags Rollup panel on the right shows:
- Unique tags — Distinct hashtags used in the period.
- Times used — How many times they were used in total.
- Engagement, Likes, Replies, Reposts, Quotes — Earned by the posts carrying them.
Top Topic Tags
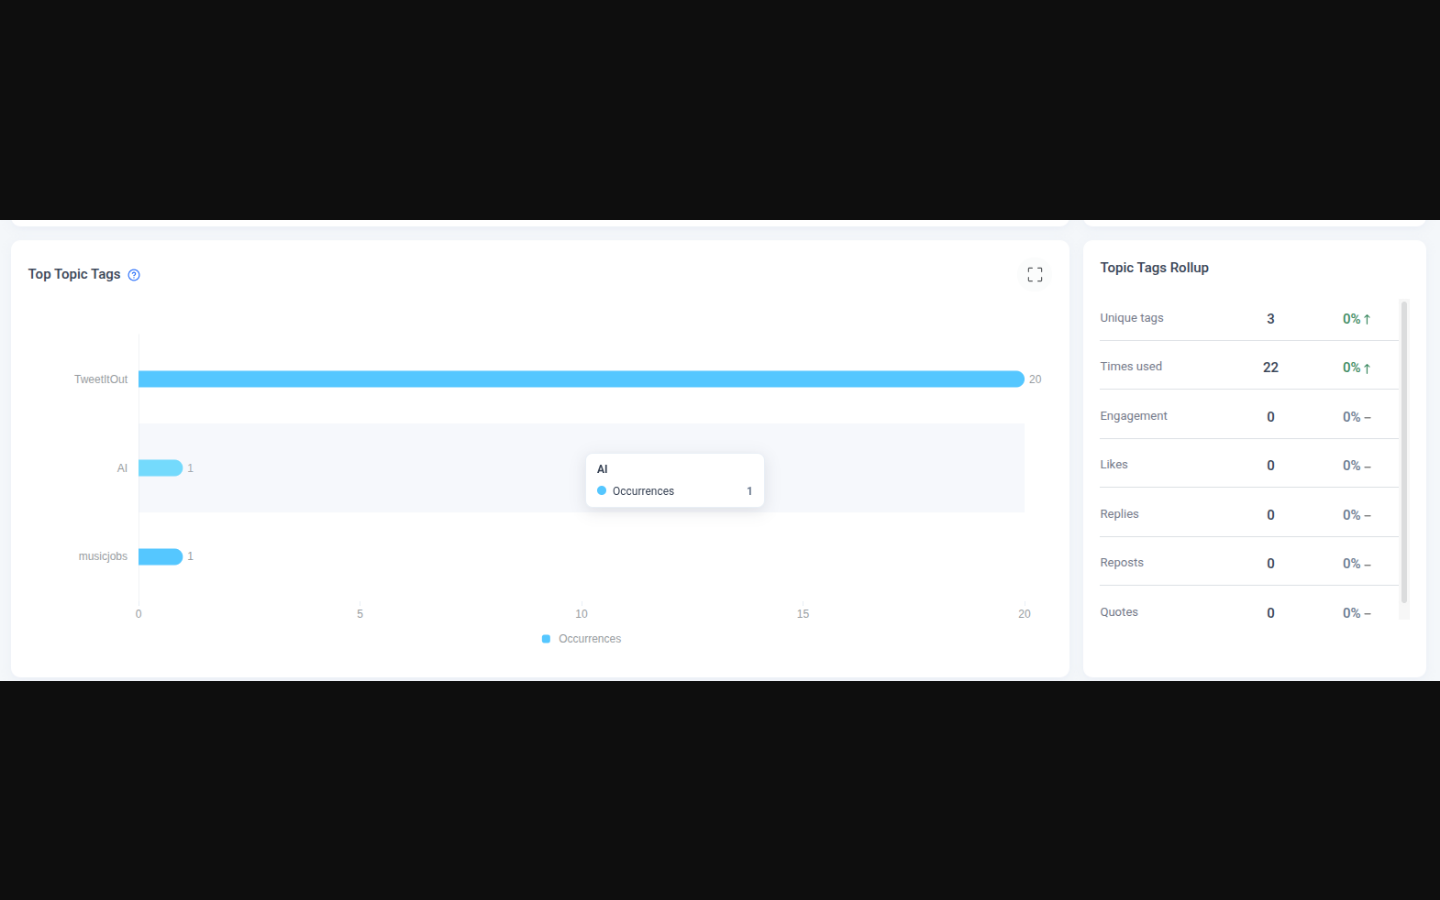
Threads topic tags are chosen from Threads' own list, and a post carries at most one — which is what makes them different from a hashtag you type yourself. This section ranks them by the engagement the posts carrying them earned, with its own Topic Tags Rollup panel.
Follower Demographics
Where your followers are and who they are — by age, gender, country and city — as Threads reported them on the date shown. Threads gives no history for this, so it describes your audience on that day rather than an average across your selected range.
Threads shares this breakdown only for accounts with at least 100 followers. Below that, the section says so rather than showing an empty chart.
[Screenshot: the Follower Demographics section]
Top Posts
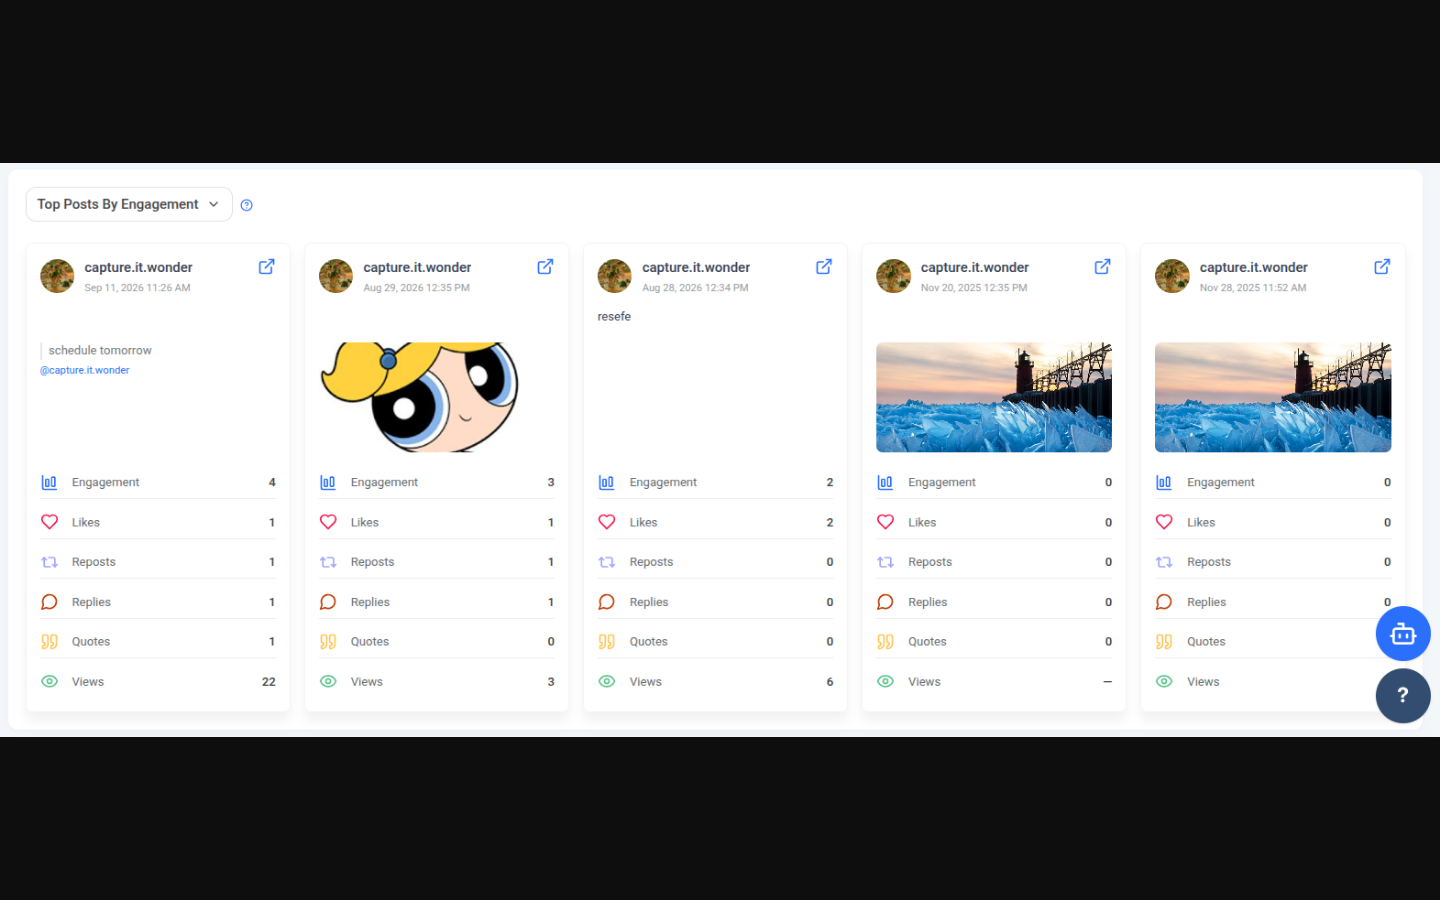
Your best-performing posts for the period, ranked by total engagement. Use the dropdown to change the ranking metric. Each card shows likes, replies, reposts, quotes and views, along with when the counters were last read, and links out to the post on Threads.
Posts Tab
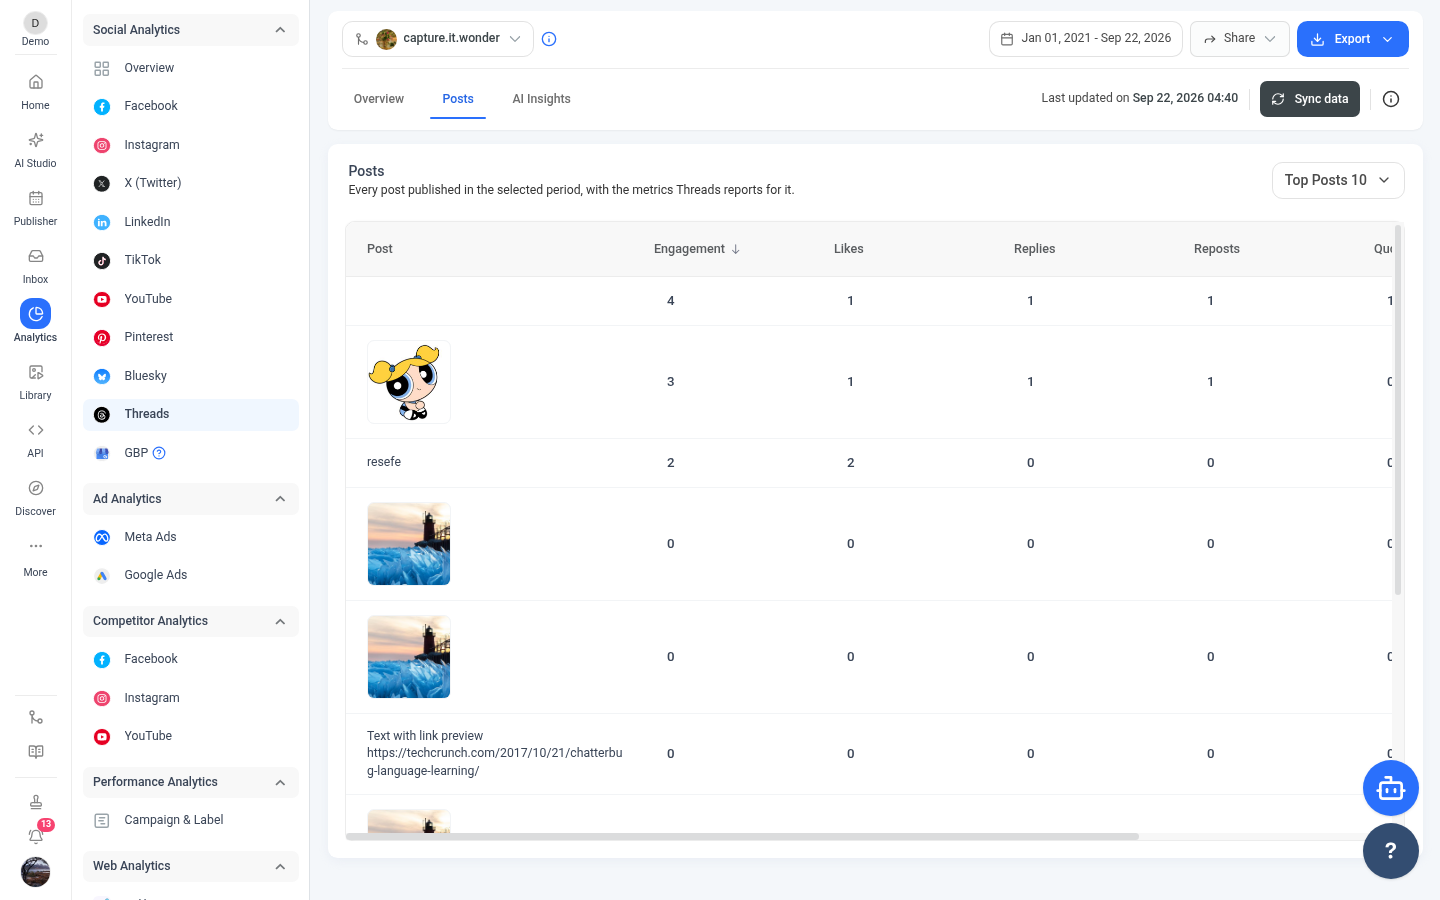
Every post published in the selected period, with the metrics Threads reports for it — engagement, likes, replies, reposts, quotes and views. Sort by any column, and click a post to open the full preview with its statistics and media type.
Post figures are lifetime totals as of the last sync, not totals for the dates you selected.
[Screenshot: the Posts tab table]
AI Insights Tab
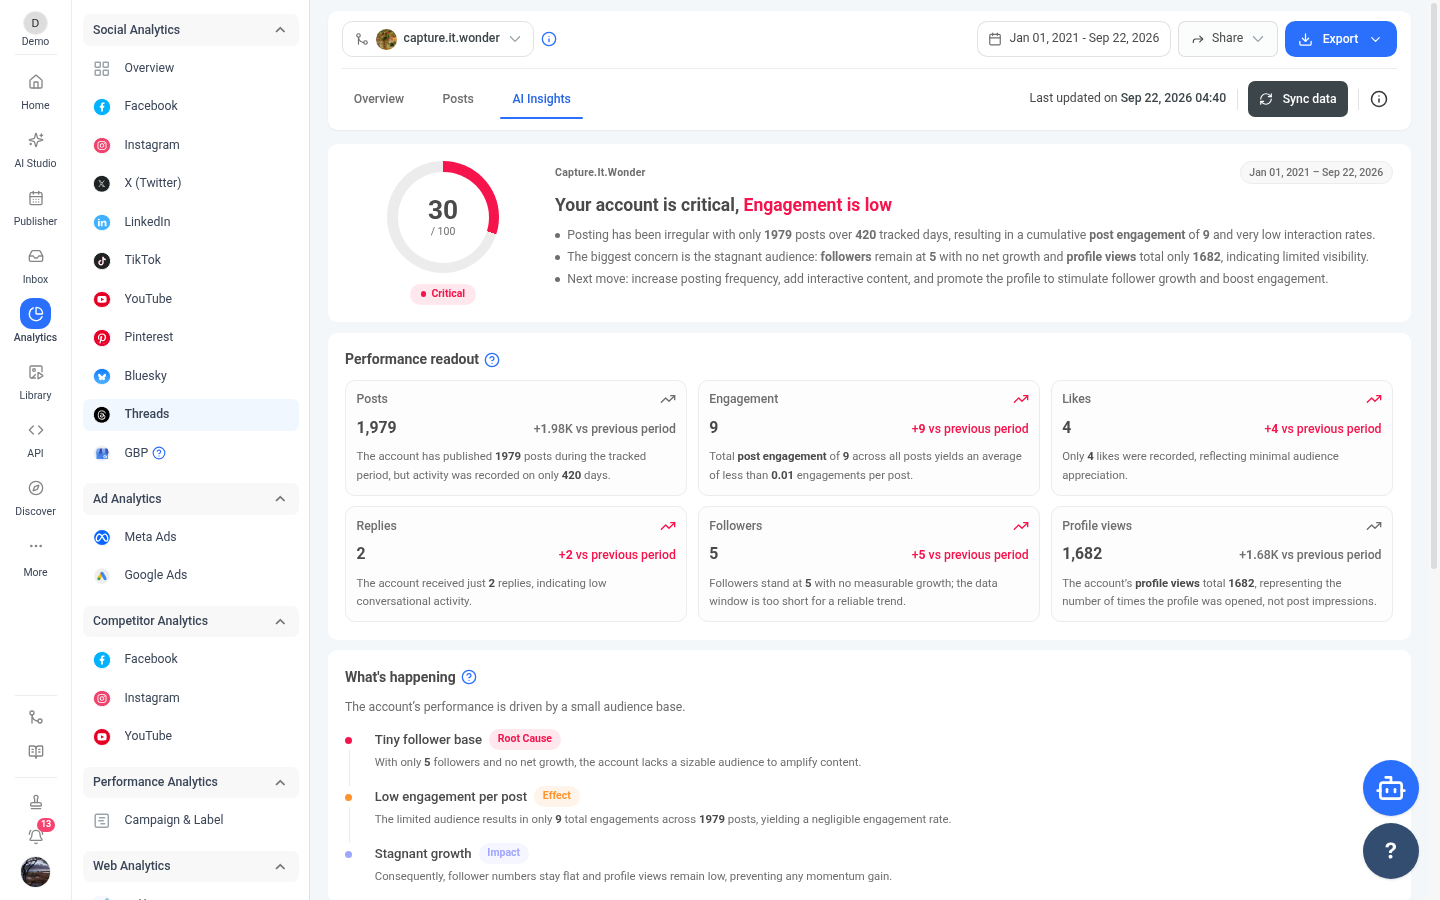
The full AI read-out: a performance summary against the previous period, what's driving it, and a ranked set of recommended actions with the reasoning and expected effect for each.
FAQs
How often does Threads Analytics data update?
Data refreshes on a scheduled sweep, and you can click Sync data at any time to pull the latest numbers immediately.
Can I track multiple Threads accounts?
Yes. Use the account selector dropdown at the top of the dashboard to switch between connected Threads accounts.
Why is my dashboard empty with a message about reconnecting?
Threads analytics requires a permission that connections made before analytics launched do not carry. Reconnect the account from the prompt and data starts flowing from the next sync. Publishing is unaffected either way.
Why don't I see impressions or reach for Threads?
Threads does not publish either, at post level or account level. The dashboard reports interactions only — likes, replies, reposts and quotes — plus profile views and link clicks.
Then what does "Views" mean?
On a post, it's the view count Threads reports for that post; Meta still labels the metric as in development, so a post that reports none shows a dash rather than a zero. The Profile views card is a different thing entirely: how often people opened your profile.
What's the difference between the Engagement chart and Account Activity?
Engagement groups each post's lifetime totals by the day it was published. Account Activity reports what actually happened on each day across your account. If you want to know "was Tuesday a good day", use Account Activity.
Why do my top posts show no numbers at all?
That post is a repost of someone else's. Threads reports no metrics for reposts, so those figures are unmeasured rather than zero.
Why does my follower chart start on a specific date instead of showing full history?
Follower trends start when the account was connected to ContentStudio. Threads returns only the current follower count and no history, so earlier days are shown as gaps.
Why is the Follower Demographics section empty?
Threads shares demographics only for accounts with at least 100 followers. The breakdown appears once the account passes that threshold and we take the first snapshot.
Why is the engagement rate different from my other dashboards?
Threads publishes no impressions, so its engagement rate is engagement divided by follower count. On Facebook, Instagram and LinkedIn the rate is divided by impressions, so the two are not directly comparable.
Are there competitor analytics for Threads?
No. Threads offers no way for tools to read another account's metrics.
What does "previous period" mean in the percentage changes?
The same number of days immediately before your selected range. For the last 30 days, the previous period is the 30 days before that.
What time zone is the data displayed in?
All analytics data follows your workspace's time zone setting.
Can I schedule recurring analytics reports for Threads?
Yes. Click Export in the top-right corner, choose Schedule PDF, and set up recurring delivery to any email address.
Was this article helpful?