

Data Studio Integration in Analytics
The Data Studio integration lets you connect your ContentStudio analytics data to Google Data Studio — a free reporting tool by Google and build visual dashboards that update automatically.
Instead of exporting data manually, your social media metrics flow directly into Data Studio, where you can create charts, filter by date range, and share polished reports with your team or clients.
With this integration, you can:
Visualise follower growth, engagement, reach, and post performance in real time
Build fully custom dashboards using drag-and-drop chart tools
Use a ready-made template that populates your data automatically
Share live report links or schedule email delivery to stakeholders
Option A — Build a custom dashboard
In ContentStudio, go to Analytics → Data Studio → Data Studio.
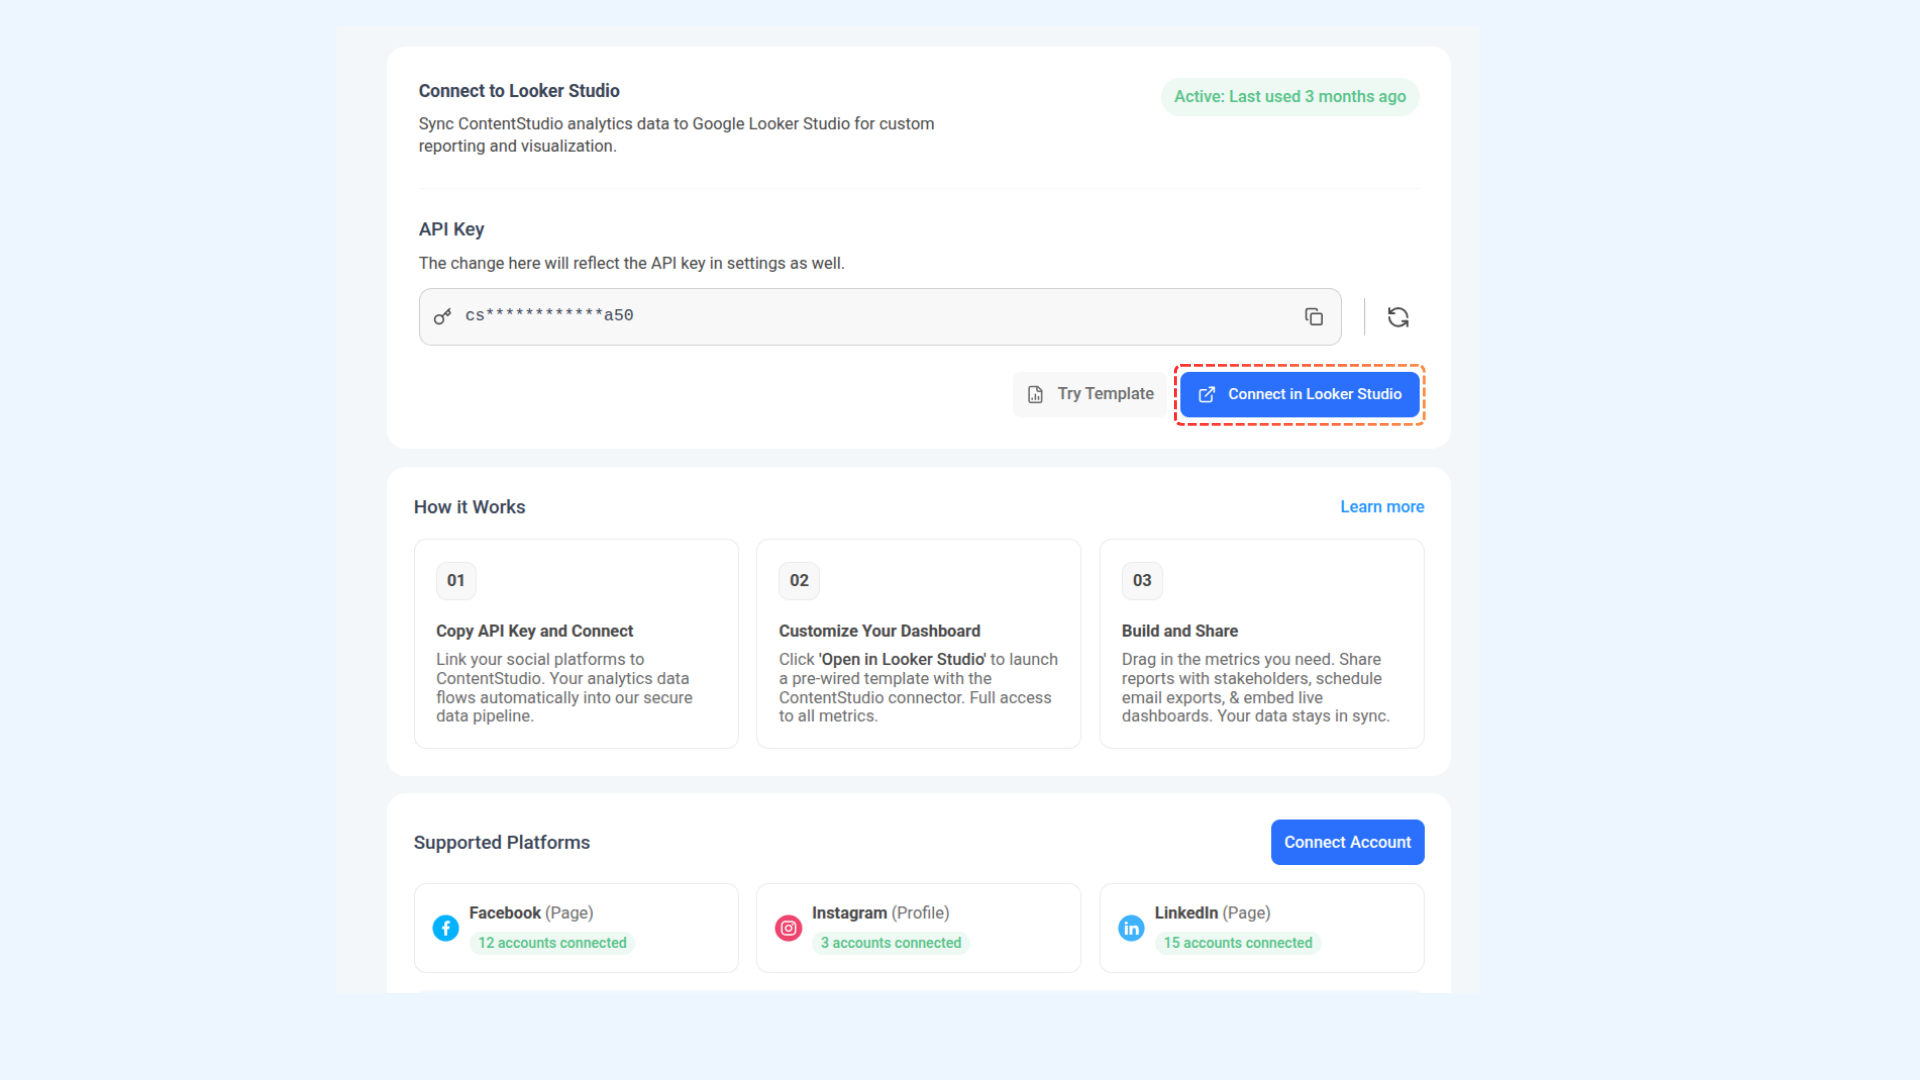
On this page you will see your API Key. This key is used automatically to authenticate your data in Data Studio — you do not need to copy or enter it manually.
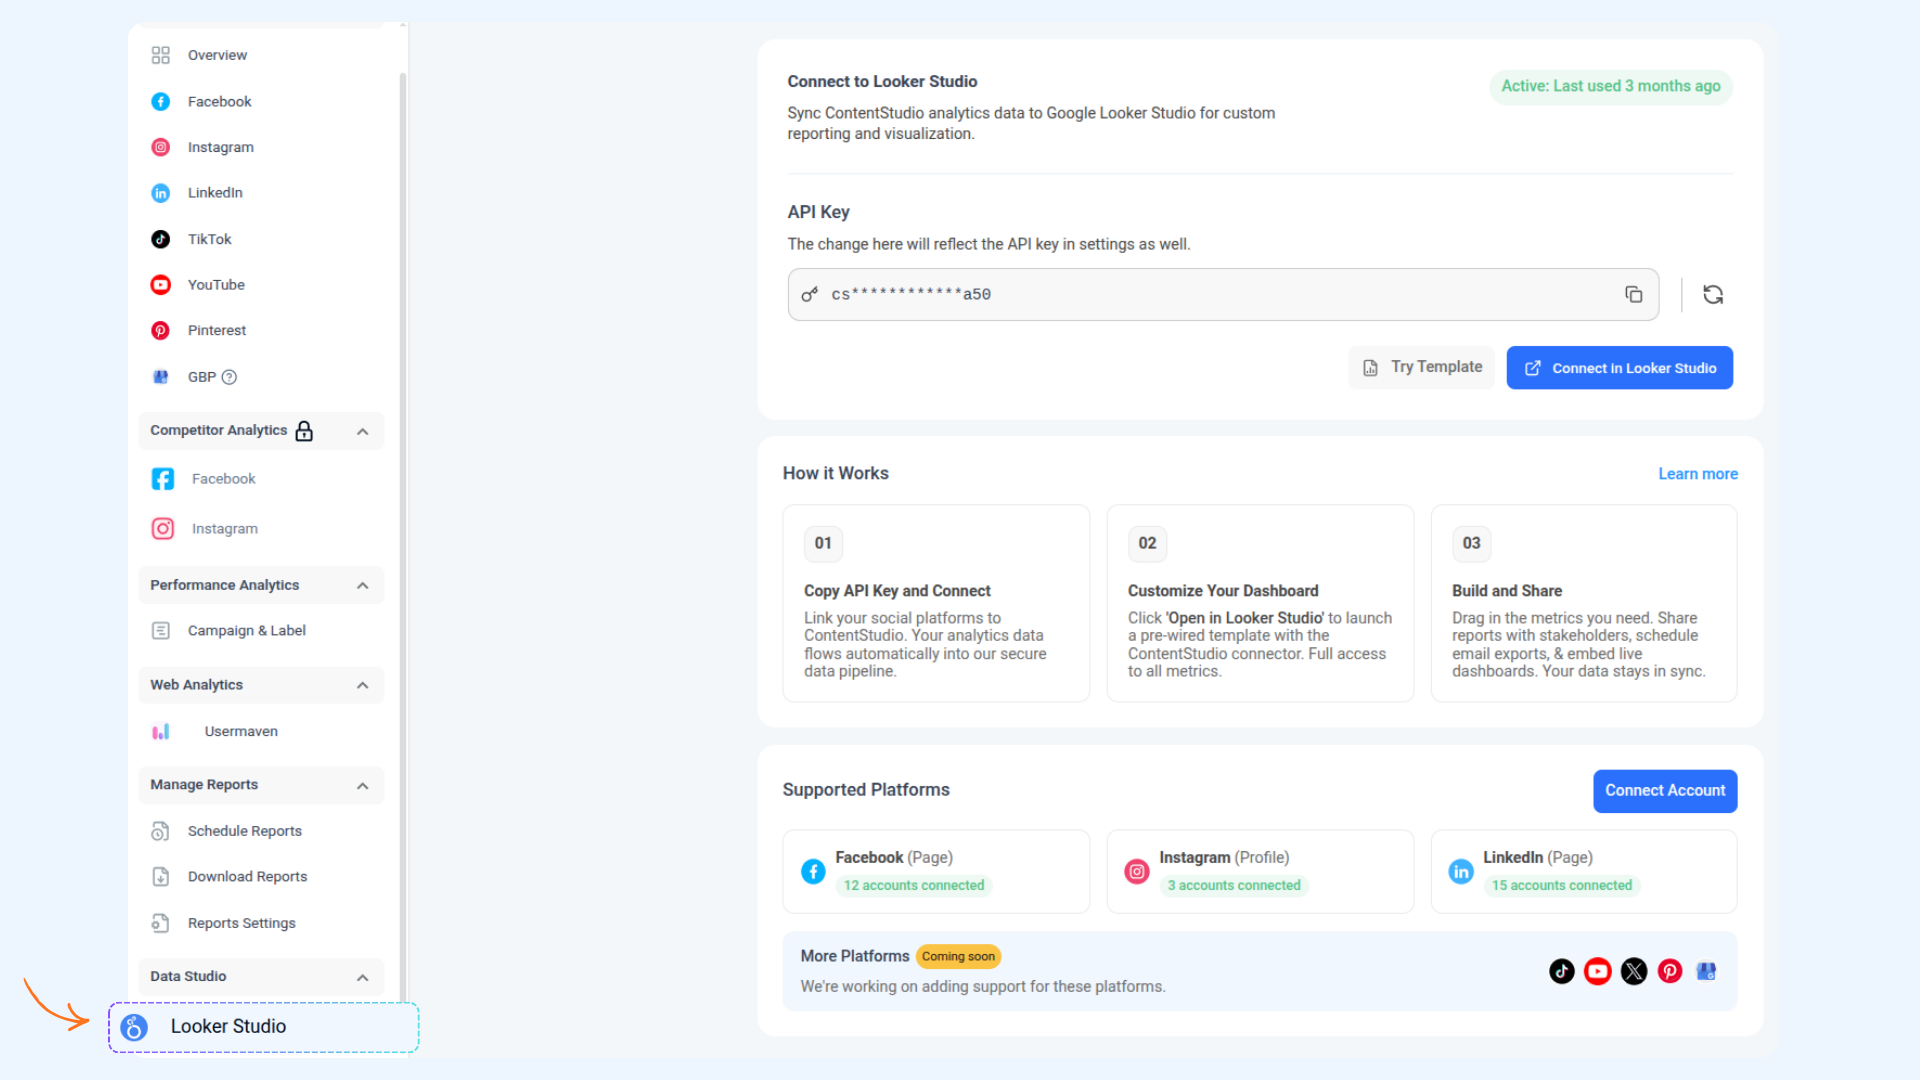
Click the Connect in Data Studio button. A new tab will open and you will be taken to Google Data Studio. If you are not already signed in to your Google account, you will be prompted to do so.
Data Studio will load a page called Untitled Data Source. You will see the ContentStudio Analytics connector listed. This is the connector that links your ContentStudio data to Data Studio.
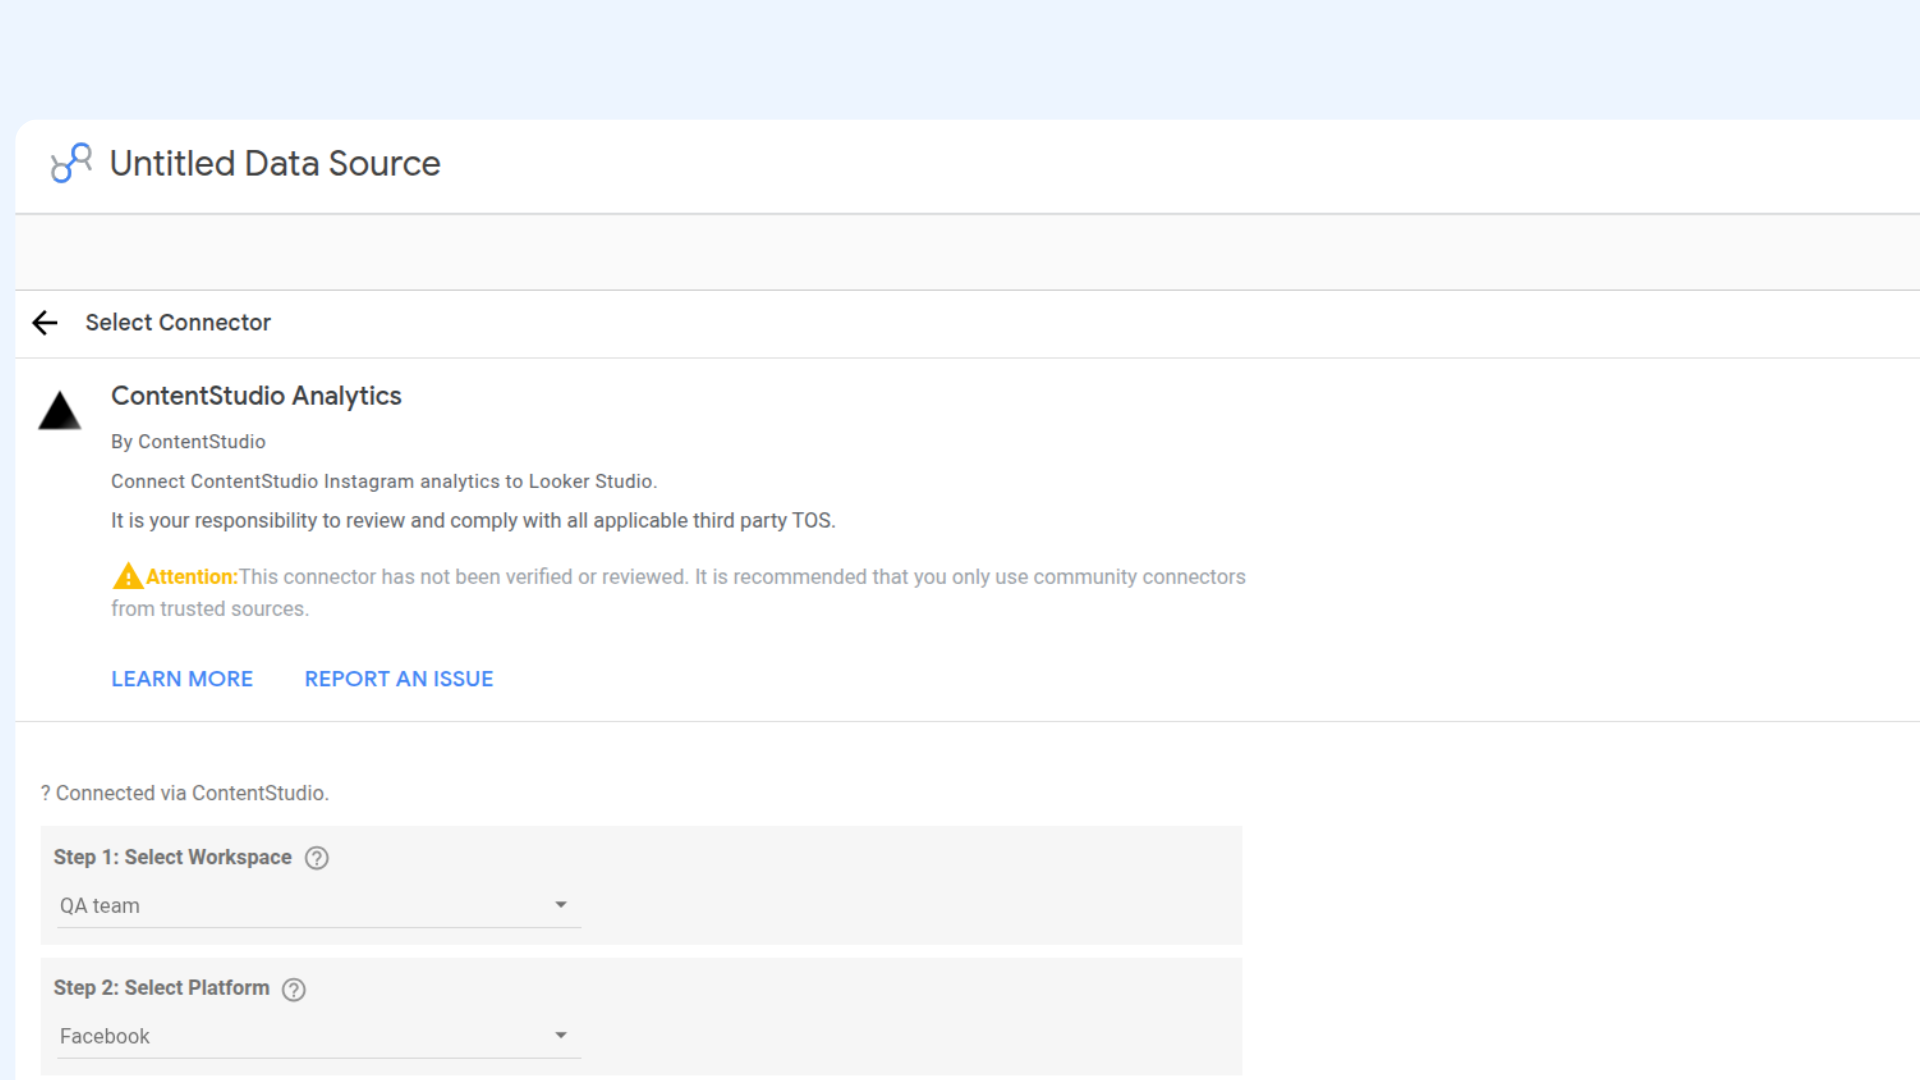
Fill in the three fields on the connector page:
Workspace — the ContentStudio workspace that contains the social accounts you want to report on
Platform — Facebook, Instagram, or LinkedIn
Account — the specific page or profile you want to report on
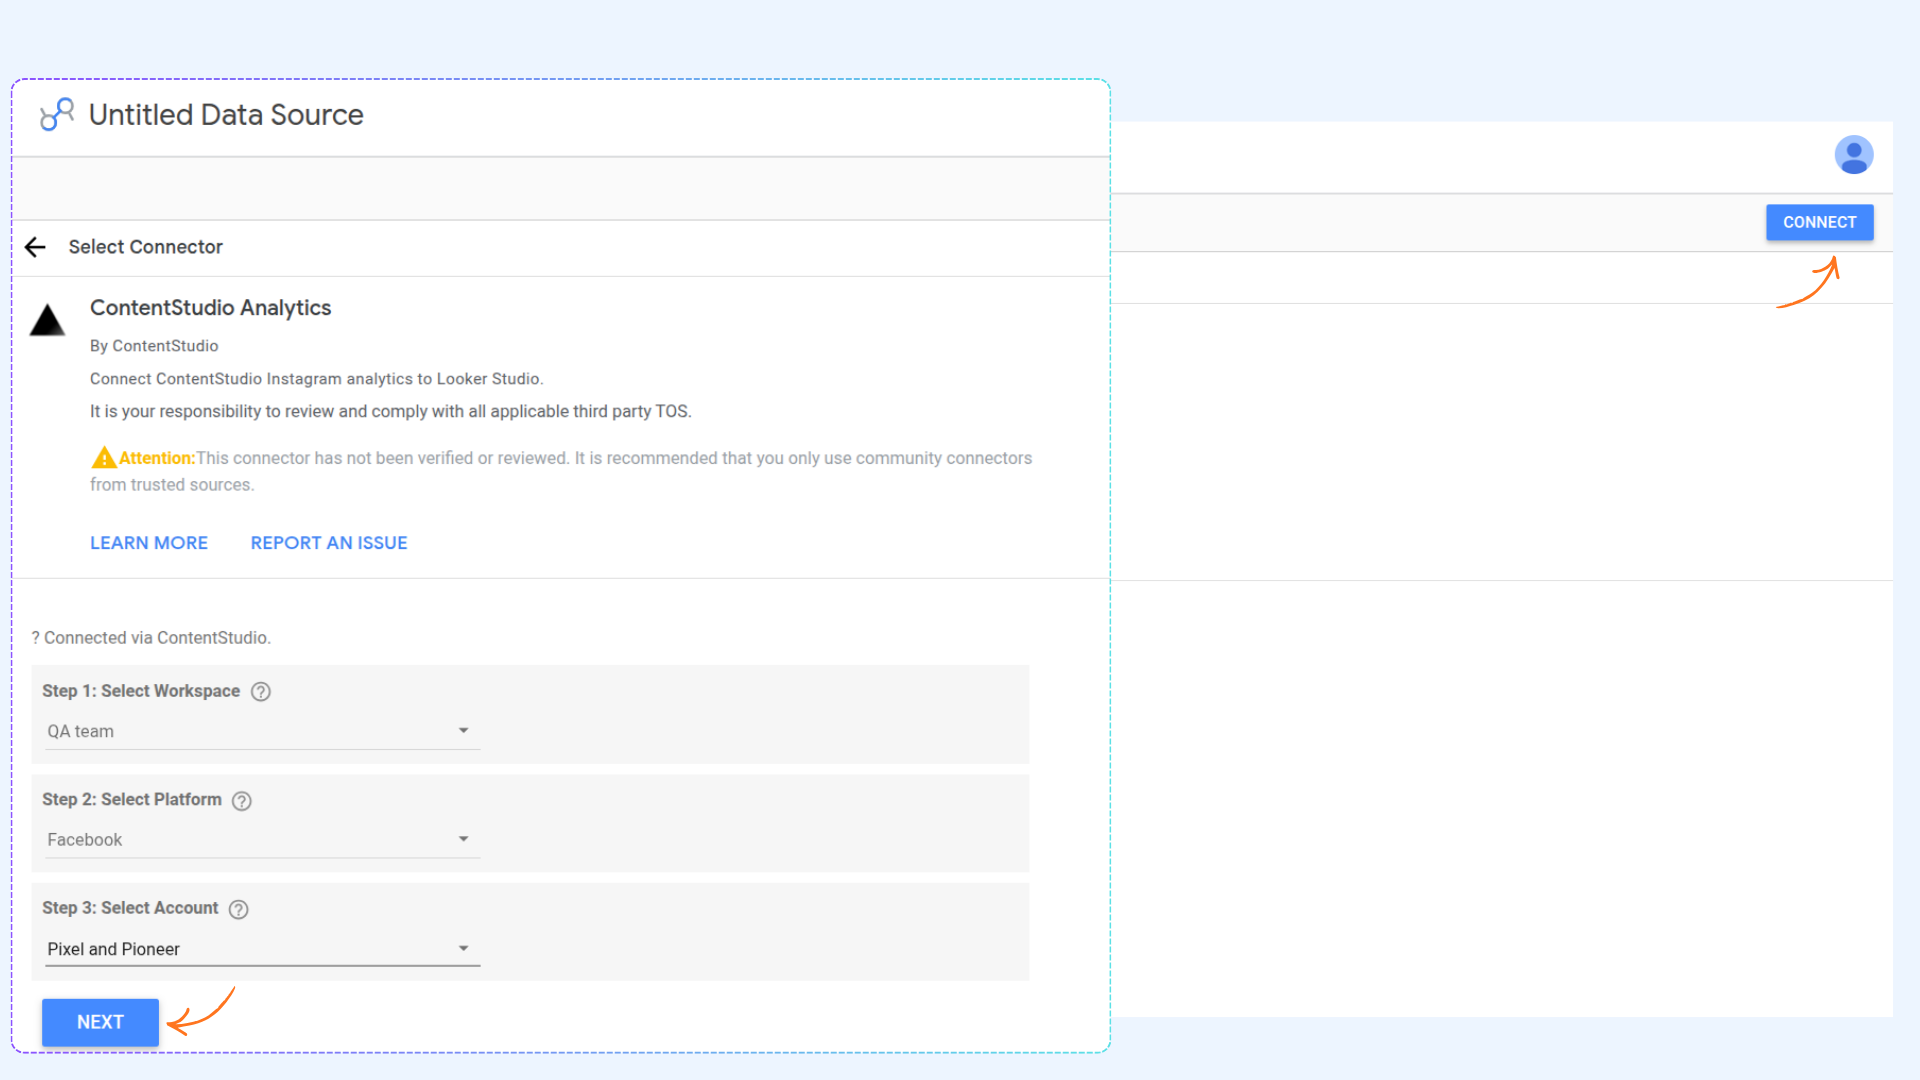
Click the Connect button in the top-right corner of the page. This establishes the live connection between your ContentStudio account and Data Studio.
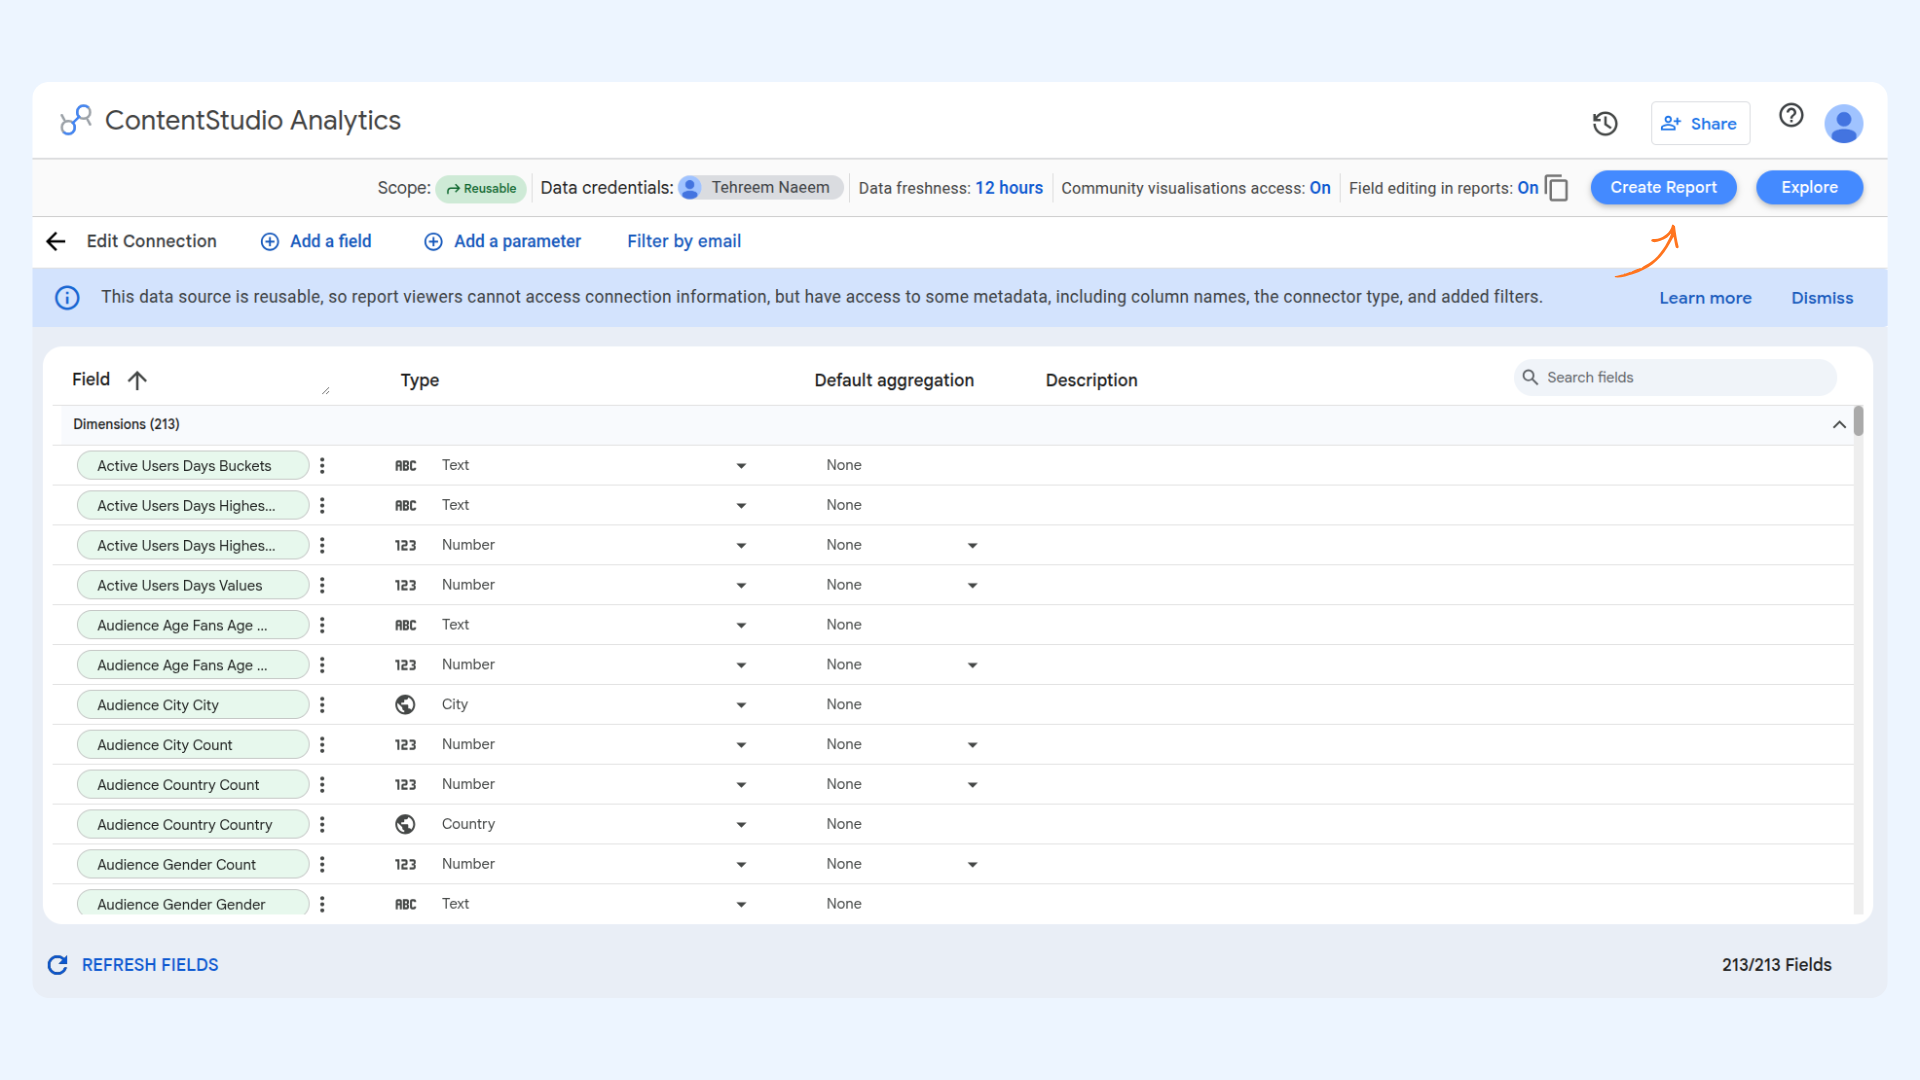
The Data Source screen
After connecting, you will land on the Data Source screen. This shows a long list of fields — things like Audience Growth, Date, Follower Demographics, Post Reach, and more. This is normal.
This screen shows every piece of analytics data available from your ContentStudio account. Think of it as a full list of metrics you can use when building your report. You do not need to change anything here.
Click Create Report in the top-right corner of the page.
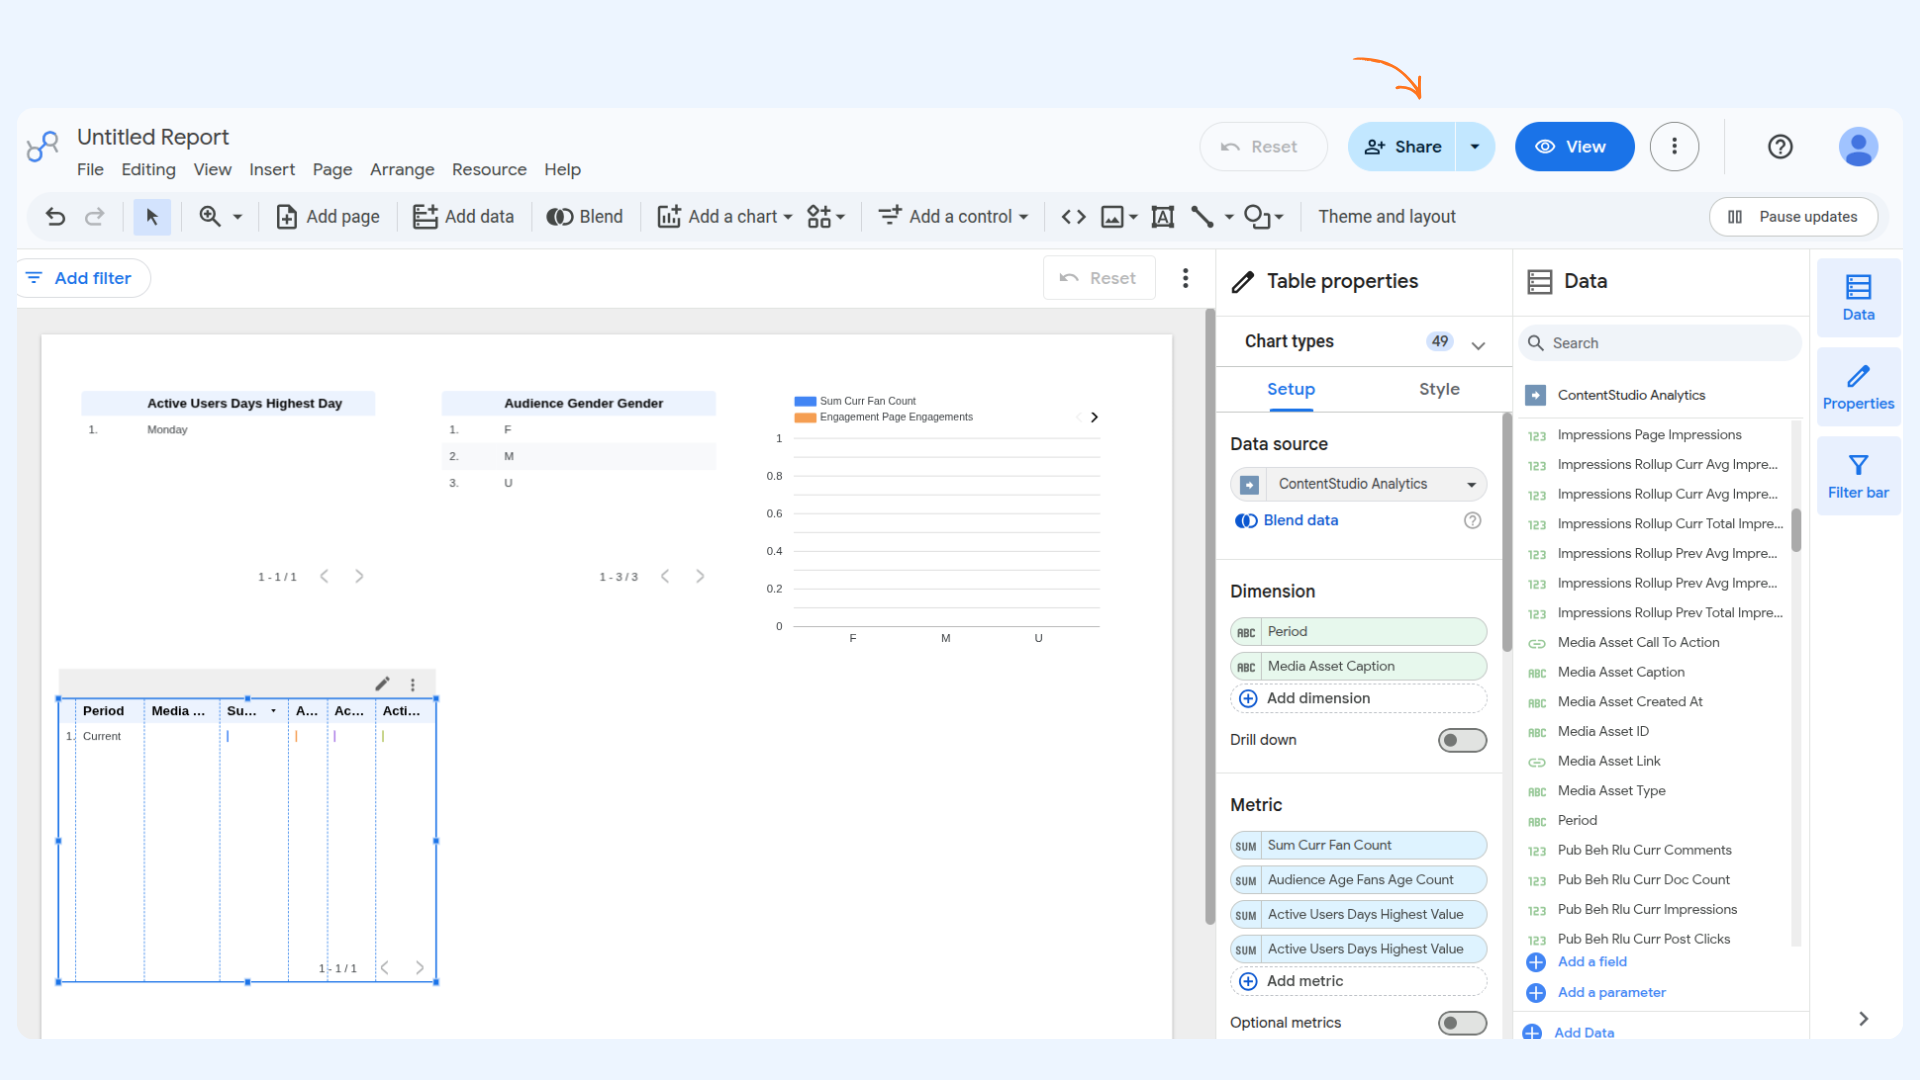
A confirmation dialog will appear. Click Add to Report. This adds your ContentStudio data to a new blank report and opens the Report Builder.
Data Studio Field Reference
ContentStudio Analytics Community Connector — complete field directory for all platforms
Naming Conventions
The tables in each platform section below use the following prefixes. Use them to interpret a field ID at a glance.
Prefix | Meaning |
|---|---|
| Aggregate total for the current selected date range. Use in scorecards alongside the matching |
| Aggregate total for the previous period (same duration, shifted back). Automatically calculated by the connector. |
| Period-level rollup fields — single row, |
| Per-day delta value. Use in time-series / line charts with the |
| Running cumulative total up to each date. Use alongside |
| Absolute change: current period value minus previous period value. |
| Percentage growth: (current − previous) ÷ previous × 100. |
| Least-performing post metric — same measure as the corresponding top-post metric but for the bottom posts. |
| Least tweet metric (Twitter/X) — mirrors the top-tweet field of the same name without the prefix. |
| Performance-schedule metric (YouTube) — avoids routing collision with channel-level trend fields. |
| Publishing behaviour rollup — period totals broken down by media type. |
| Facebook top-post media-asset fields — one value per asset, joined with commas when a post has multiple assets. |
▶Summary
Single-row response with current & previous period totals. Add to a scorecard; pair sum_curr_* with sum_prev_* to show period-over-period change.
Field ID | Display Name | Kind | Description |
|---|---|---|---|
period | Period | Dim | Always "Current" — used as the row identifier in single-row scorecard sources. |
sum_curr_fan_count | Sum Curr Fan Count | Metric | Total page fans (likes) at the end of the current period. |
sum_curr_doc_count | Sum Curr Doc Count | Metric | Number of posts published during the current period. |
sum_curr_total_engagement | Sum Curr Total Engagement | Metric | Sum of all post-level engagement actions (reactions + comments + clicks + shares) in the current period. |
sum_curr_reactions | Sum Curr Reactions | Metric | Total post reactions (Like, Love, Haha, Wow, Sad, Angry, Thankful) in the current period. |
sum_curr_comments | Sum Curr Comments | Metric | Total post comments in the current period. |
sum_curr_posts_clicks | Sum Curr Posts Clicks | Metric | Total post link clicks in the current period. |
sum_curr_impressions | Sum Curr Impressions | Metric | Total post impressions (all sources) in the current period. |
sum_curr_reach | Sum Curr Reach | Metric | Unique accounts reached by posts in the current period. |
sum_curr_repost | Sum Curr Repost | Metric | Total post shares (reposts) in the current period. |
sum_curr_positive_sentiment | Sum Curr Positive Sentiment | Metric | Positive feedback actions on page posts in the current period. |
sum_curr_negative_sentiment | Sum Curr Negative Sentiment | Metric | Negative feedback actions (hide post, report) in the current period. |
sum_curr_page_impressions | Sum Curr Page Impressions | Metric | Total page-level impressions (all content, all sources) in the current period. |
sum_curr_page_impressions_paid | Sum Curr Page Impressions Paid | Metric | Page impressions driven by paid/boosted content in the current period. |
sum_curr_page_impressions_organic | Sum Curr Page Impressions Organic | Metric | Page impressions from organic (non-paid) content in the current period. |
sum_curr_page_engagements | Sum Curr Page Engagements | Metric | Total engagement actions on the page (posts, stories, check-ins) in the current period. |
sum_curr_page_positive_feedback | Sum Curr Page Positive Feedback | Metric | Positive page-level feedback (likes, comments, shares on any page content). |
sum_curr_page_negative_feedback | Sum Curr Page Negative Feedback | Metric | Negative page-level feedback (hides, unlikes, spam reports). |
sum_curr_talking_about_count | Sum Curr Talking About Count | Metric | Number of people who created a story about the page this period (likes, posts, check-ins, etc.). |
sum_curr_page_follows | Sum Curr Page Follows | Metric | Total page followers (distinct from fans — people who follow without liking) at period end. |
sum_prev_fan_count | Sum Prev Fan Count | Metric | Page fans at the end of the previous period. |
sum_prev_doc_count | Sum Prev Doc Count | Metric | Posts published during the previous period. |
sum_prev_total_engagement | Sum Prev Total Engagement | Metric | Total engagement in the previous period. |
sum_prev_reactions | Sum Prev Reactions | Metric | Post reactions in the previous period. |
sum_prev_comments | Sum Prev Comments | Metric | Post comments in the previous period. |
sum_prev_posts_clicks | Sum Prev Posts Clicks | Metric | Post link clicks in the previous period. |
sum_prev_impressions | Sum Prev Impressions | Metric | Post impressions in the previous period. |
sum_prev_reach | Sum Prev Reach | Metric | Unique accounts reached in the previous period. |
sum_prev_repost | Sum Prev Repost | Metric | Post shares in the previous period. |
sum_prev_positive_sentiment | Sum Prev Positive Sentiment | Metric | Positive feedback in the previous period. |
sum_prev_negative_sentiment | Sum Prev Negative Sentiment | Metric | Negative feedback in the previous period. |
sum_prev_page_impressions | Sum Prev Page Impressions | Metric | Page-level impressions in the previous period. |
sum_prev_page_impressions_paid | Sum Prev Page Impressions Paid | Metric | Paid page impressions in the previous period. |
sum_prev_page_impressions_organic | Sum Prev Page Impressions Organic | Metric | Organic page impressions in the previous period. |
sum_prev_page_engagements | Sum Prev Page Engagements | Metric | Page engagements in the previous period. |
sum_prev_page_positive_feedback | Sum Prev Page Positive Feedback | Metric | Positive page feedback in the previous period. |
sum_prev_page_negative_feedback | Sum Prev Page Negative Feedback | Metric | Negative page feedback in the previous period. |
sum_prev_talking_about_count | Sum Prev Talking About Count | Metric | People talking about the page in the previous period. |
sum_prev_page_follows | Sum Prev Page Follows | Metric | Page followers in the previous period. |
▶Audience Growth (Daily)
One row per day. Use with the date dimension in a time-series chart to visualise fan and engagement growth over time.
Field ID | Display Name | Kind | Description |
|---|---|---|---|
date | Date | Dim | Day of the data point (YYYYMMDD). |
audience_growth_fan_count | Audience Growth Fan Count | Metric | Cumulative fan (page like) count on this date. |
audience_growth_page_fans_daily | Audience Growth Page Fans Daily | Metric | Net new fans gained on this specific day. |
audience_growth_page_fans_by_like | Audience Growth Page Fans By Like | Metric | Fans added via page like on this day. |
audience_growth_page_fans_by_unlike | Audience Growth Page Fans By Unlike | Metric | Fans lost via page unlike on this day. |
audience_growth_page_impressions | Audience Growth Page Impressions | Metric | Total page impressions on this day. |
audience_growth_page_engagements | Audience Growth Page Engagements | Metric | Total page engagements on this day. |
▶Audience Growth Rollup
Single row comparing current vs previous period fan metrics. Ideal for scorecard tiles.
Field ID | Display Name | Kind | Description |
|---|---|---|---|
audience_growth_rollup_curr_fan_count | Audience Growth Rollup Curr Fan Count | Metric | Fan count at the end of the current period. |
audience_growth_rollup_curr_avg_page_fans_by_like | … Curr Avg Page Fans By Like | Metric | Average daily fans gained by liking in the current period. |
audience_growth_rollup_curr_avg_page_fans_by_unlike | … Curr Avg Page Fans By Unlike | Metric | Average daily fans lost by unliking in the current period. |
audience_growth_rollup_curr_talking_about_count | … Curr Talking About Count | Metric | Total people talking about the page in the current period. |
audience_growth_rollup_curr_doc_count | … Curr Doc Count | Metric | Posts published in the current period. |
audience_growth_rollup_prev_fan_count | … Prev Fan Count | Metric | Fan count at the end of the previous period. |
audience_growth_rollup_prev_avg_page_fans_by_like | … Prev Avg Page Fans By Like | Metric | Average daily fans gained by liking in the previous period. |
audience_growth_rollup_prev_avg_page_fans_by_unlike | … Prev Avg Page Fans By Unlike | Metric | Average daily fans lost in the previous period. |
audience_growth_rollup_prev_talking_about_count | … Prev Talking About Count | Metric | People talking about the page in the previous period. |
audience_growth_rollup_prev_doc_count | … Prev Doc Count | Metric | Posts published in the previous period. |
▶Publishing Behaviour (Daily)
One row per day showing post volume and reach/engagement breakdown by distribution type.
Field ID | Display Name | Kind | Description |
|---|---|---|---|
date | Date | Dim | Day of the data point. |
publishing_behaviour_post_count | Post Count | Metric | Number of posts published on this day. |
publishing_behaviour_reactions_engagement | Reactions Engagement | Metric | Total reaction actions on posts published this day. |
publishing_behaviour_comments_engagement | Comments Engagement | Metric | Total comments on posts published this day. |
publishing_behaviour_shares_engagement | Shares Engagement | Metric | Total shares on posts published this day. |
publishing_behaviour_organic_reach | Organic Reach | Metric | Unique accounts reached organically on this day. |
publishing_behaviour_paid_reach | Paid Reach | Metric | Unique accounts reached via paid/boosted distribution on this day. |
publishing_behaviour_viral_reach | Viral Reach | Metric | Unique accounts reached through a friend's interaction (viral) on this day. |
publishing_behaviour_organic_impressions | Organic Impressions | Metric | Total organic impressions on this day. |
publishing_behaviour_paid_impressions | Paid Impressions | Metric | Total paid impressions on this day. |
publishing_behaviour_viral_impressions | Viral Impressions | Metric | Total viral impressions on this day. |
▶Publishing Behaviour Rollup
Period totals for posting activity. Single row — use in scorecards.
Field ID | Display Name | Kind | Description |
|---|---|---|---|
pub_beh_rlu_curr_doc_count | Pub Beh Rlu Curr Doc Count | Metric | Posts published in the current period. |
pub_beh_rlu_curr_total_engagement | … Curr Total Engagement | Metric | Total engagement on all posts in the current period. |
pub_beh_rlu_curr_reactions | … Curr Reactions | Metric | Total reactions in the current period. |
pub_beh_rlu_curr_comments | … Curr Comments | Metric | Total comments in the current period. |
pub_beh_rlu_curr_post_clicks | … Curr Post Clicks | Metric | Total link clicks in the current period. |
pub_beh_rlu_curr_impressions | … Curr Impressions | Metric | Total post impressions in the current period. |
pub_beh_rlu_curr_shares | … Curr Shares | Metric | Total post shares in the current period. |
pub_beh_rlu_prev_doc_count | … Prev Doc Count | Metric | Posts published in the previous period. |
pub_beh_rlu_prev_total_engagement | … Prev Total Engagement | Metric | Total engagement in the previous period. |
pub_beh_rlu_prev_reactions | … Prev Reactions | Metric | Reactions in the previous period. |
pub_beh_rlu_prev_comments | … Prev Comments | Metric | Comments in the previous period. |
pub_beh_rlu_prev_post_clicks | … Prev Post Clicks | Metric | Link clicks in the previous period. |
pub_beh_rlu_prev_impressions | … Prev Impressions | Metric | Impressions in the previous period. |
pub_beh_rlu_prev_shares | … Prev Shares | Metric | Shares in the previous period. |
▶Impressions (Daily) & Rollup
impressions_page_impressions is the daily field for time-series charts. The rollup fields give period totals and averages for scorecards.
Field ID | Display Name | Kind | Description |
|---|---|---|---|
impressions_page_impressions | Impressions Page Impressions | Metric | Total page impressions on this day. |
impressions_rollup_curr_total_impressions | Rollup Curr Total Impressions | Metric | Total page impressions for the current period. |
impressions_rollup_curr_avg_impressions_per_day | Rollup Curr Avg / Day | Metric | Average daily impressions in the current period. |
impressions_rollup_curr_avg_impressions_per_week | Rollup Curr Avg / Week | Metric | Average weekly impressions in the current period. |
impressions_rollup_prev_total_impressions | Rollup Prev Total Impressions | Metric | Total page impressions for the previous period. |
impressions_rollup_prev_avg_impressions_per_day | Rollup Prev Avg / Day | Metric | Average daily impressions in the previous period. |
impressions_rollup_prev_avg_impressions_per_week | Rollup Prev Avg / Week | Metric | Average weekly impressions in the previous period. |
▶Engagement (Daily) & Rollup
Daily page engagement for trend charts; rollup gives current vs previous averages for scorecards.
Field ID | Display Name | Kind | Description |
|---|---|---|---|
engagement_page_engagements | Engagement Page Engagements | Metric | Total engagement actions on the page on this day. |
engagement_rollup_curr_page_engagements | Rollup Curr Page Engagements | Metric | Total page engagements for the current period. |
engagement_rollup_curr_avg_engagements_per_day | Rollup Curr Avg / Day | Metric | Average daily engagements in the current period. |
engagement_rollup_curr_avg_engagements_per_week | Rollup Curr Avg / Week | Metric | Average weekly engagements in the current period. |
engagement_rollup_prev_page_engagements | Rollup Prev Page Engagements | Metric | Total page engagements for the previous period. |
engagement_rollup_prev_avg_engagements_per_day | Rollup Prev Avg / Day | Metric | Average daily engagements in the previous period. |
engagement_rollup_prev_avg_engagements_per_week | Rollup Prev Avg / Week | Metric | Average weekly engagements in the previous period. |
▶Video Insights (Daily) & Rollup
Daily video performance for time-series charts. Rollup fields give current vs previous period totals for scorecards.
Field ID | Display Name | Kind | Description |
|---|---|---|---|
video_insights_total_views | Video Insights Total Views | Metric | Total video views (all sources) on this day. |
video_insights_organic_views | Video Insights Organic Views | Metric | Organic video views on this day. |
video_insights_paid_views | Video Insights Paid Views | Metric | Paid/boosted video views on this day. |
video_insights_total_view_time | Video Insights Total View Time | Metric | Total video view time (ms) on this day. |
video_insights_organic_view_time | Video Insights Organic View Time | Metric | Organic video view time (ms) on this day. |
video_insights_paid_view_time | Video Insights Paid View Time | Metric | Paid video view time (ms) on this day. |
video_insights_comments | Video Insights Comments | Metric | Video comments on this day. |
video_insights_reactions | Video Insights Reactions | Metric | Video reactions on this day. |
video_insights_shares | Video Insights Shares | Metric | Video shares on this day. |
video_insights_total_posts | Video Insights Total Posts | Metric | Number of video posts published on this day. |
video_rollup_curr_total_views | Video Rollup Curr Total Views | Metric | Total video views for the current period. |
video_rollup_curr_organic_views | … Curr Organic Views | Metric | Organic video views for the current period. |
video_rollup_curr_paid_views | … Curr Paid Views | Metric | Paid video views for the current period. |
video_rollup_curr_total_view_time | … Curr Total View Time | Metric | Total video view time for the current period. |
video_rollup_curr_comments | … Curr Comments | Metric | Video comments for the current period. |
video_rollup_curr_reactions | … Curr Reactions | Metric | Video reactions for the current period. |
video_rollup_curr_shares | … Curr Shares | Metric | Video shares for the current period. |
video_rollup_curr_total_posts | … Curr Total Posts | Metric | Video posts published in the current period. |
video_rollup_prev_* | … Prev … | Metric | Same metrics as above for the previous period ( |
▶Reels (Daily) & Rollup
Daily Reels performance for trend charts plus period rollup for scorecards.
Field ID | Display Name | Kind | Description |
|---|---|---|---|
reels_initial_plays | Reels Initial Plays | Metric | Number of times a Reel started playing (initial play count) on this day. |
reels_total_reels | Reels Total Reels | Metric | Number of Reels published on this day. |
reels_total_seconds_watched | Reels Total Seconds Watched | Metric | Total seconds watched across all Reels on this day. |
reels_engagement | Reels Engagement | Metric | Total engagement (reactions + comments + shares) on Reels this day. |
reels_reactions | Reels Reactions | Metric | Reactions on Reels this day. |
reels_comments | Reels Comments | Metric | Comments on Reels this day. |
reels_shares | Reels Shares | Metric | Shares of Reels this day. |
reels_rollup_curr_total_reels | Reels Rollup Curr Total Reels | Metric | Total Reels published in the current period. |
reels_rollup_curr_initial_plays | … Curr Initial Plays | Metric | Total initial plays in the current period. |
reels_rollup_curr_total_seconds_watched | … Curr Total Seconds Watched | Metric | Total seconds watched in the current period. |
reels_rollup_curr_average_seconds_watched | … Curr Average Seconds Watched | Metric | Average watch time per Reel play in the current period. |
reels_rollup_curr_reach | … Curr Reach | Metric | Unique accounts reached by Reels in the current period. |
reels_rollup_curr_engagement | … Curr Engagement | Metric | Total Reels engagement in the current period. |
reels_rollup_curr_reactions | … Curr Reactions | Metric | Reels reactions in the current period. |
reels_rollup_curr_comments | … Curr Comments | Metric | Reels comments in the current period. |
reels_rollup_curr_shares | … Curr Shares | Metric | Reels shares in the current period. |
reels_rollup_prev_* | … Prev … | Metric | Same nine metrics as above for the previous period. |
▶Top Posts
One row per post (top 10 by engagement). Use in a table or gallery chart. Media asset fields are comma-joined when a post has multiple assets.
Field ID | Display Name | Kind | Description |
|---|---|---|---|
top_posts_created_time | Created Time | Dim | Date the post was published. |
top_posts_page_name | Page Name | Dim | Name of the Facebook page. |
top_posts_page_id | Page ID | Dim | Facebook page identifier. |
top_posts_post_id | Post ID | Dim | Unique Facebook post identifier. |
top_posts_permalink | Permalink | Dim | Direct URL to the post on Facebook. |
top_posts_status_type | Status Type | Dim | Facebook status type (added_photos, shared_story, mobile_status_update, etc.). |
top_posts_media_type | Media Type | Dim | Content type of the post (photo, video, link, status, etc.). |
top_posts_caption | Caption | Dim | Post caption / message text. |
top_posts_description | Description | Dim | Post description (for link shares). |
top_posts_full_picture | Full Picture | Dim | URL of the post's primary image. |
top_posts_day_of_week | Day Of Week | Dim | Day of week the post was published (Monday–Sunday). |
top_posts_message_tags | Message Tags | Dim | JSON array of people/pages tagged in the post. |
tp_medass_media_id | Media Asset ID | Dim | ID(s) of attached media assets, comma-joined for carousel posts. |
tp_medass_asset_type | Media Asset Type | Dim | Type of each media asset (photo, video), comma-joined. |
tp_medass_link | Media Asset Link | Dim | URL(s) of media assets, comma-joined. |
tp_medass_call_to_action | Media Asset Call To Action | Dim | Call-to-action URL(s) on media assets, comma-joined. |
top_posts_hour_of_day | Hour Of Day | Metric | Hour (0–23) when the post was published. |
top_posts_like | Like | Metric | Number of Like reactions on the post. |
top_posts_love | Love | Metric | Number of Love reactions on the post. |
top_posts_haha | Haha | Metric | Number of Haha reactions on the post. |
top_posts_wow | Wow | Metric | Number of Wow reactions on the post. |
top_posts_sad | Sad | Metric | Number of Sad reactions on the post. |
top_posts_angry | Angry | Metric | Number of Angry reactions on the post. |
top_posts_total | Total Reactions | Metric | Sum of all reaction types on the post. |
top_posts_shares | Shares | Metric | Number of times the post was shared. |
top_posts_comments | Comments | Metric | Number of comments on the post. |
top_posts_post_clicks | Post Clicks | Metric | Total link clicks on the post. |
top_posts_total_engagement | Total Engagement | Metric | Sum of all engagement actions on the post. |
top_posts_post_impressions | Post Impressions | Metric | Total impressions for this post (all sources). |
top_posts_post_impressions_paid | Post Impressions Paid | Metric | Paid/boosted impressions for this post. |
top_posts_post_impressions_organic | Post Impressions Organic | Metric | Organic impressions for this post. |
top_posts_post_impressions_viral | Post Impressions Viral | Metric | Viral impressions (from friend interactions) for this post. |
top_posts_post_video_views | Post Video Views | Metric | Video views for this post (if video content). |
top_posts_total_impressions | Total Impressions | Metric | Total impressions including all organic, paid, and viral sources. |
▶Active Users (Day of Week)
Shows which days of the week your audience is most active. Use in a bar chart with active_users_days_buckets as the dimension.
Field ID | Display Name | Kind | Description |
|---|---|---|---|
active_users_days_buckets | Active Users Days Buckets | Dim | Day of week label (e.g. "Monday"). |
active_users_days_values | Active Users Days Values | Metric | Relative activity level for this day of week. |
active_users_days_highest_value | Highest Value | Metric | Peak activity value across all days — repeated on every row for reference. |
active_users_days_highest_day | Highest Day | Dim | Name of the most active day — repeated on every row for reference. |
▶Demographics — Age, Gender, Location
Each section produces one row per bucket. Use in a pie or bar chart.
Field ID | Display Name | Kind | Description |
|---|---|---|---|
audience_age_fans_age_bracket | Age Bracket | Dim | Age range of fans (e.g. "18-24", "25-34"). |
audience_age_fans_age_count | Age Count | Metric | Number of fans in this age bracket. |
audience_gender_gender | Gender | Dim | Gender segment (F, M, U). |
audience_gender_count | Gender Count | Metric | Number of fans in this gender segment. |
audience_city_city | City | Dim | City name of page fans. |
audience_city_count | City Count | Metric | Number of fans from this city. |
audience_country_country | Country | Dim | Country of page fans. |
audience_country_count | Country Count | Metric | Number of fans from this country. |
▶Summary
Single-row response with current & previous period totals for all key Instagram metrics.
Field ID | Display Name | Kind | Description |
|---|---|---|---|
period | Period | Dim | Always "Current" — row identifier for single-row scorecard sources. |
sum_curr_total_posts | Sum Curr Total Posts | Metric | Posts published in the current period. |
sum_curr_post_engagement | Sum Curr Post Engagement | Metric | Total post-level engagement (likes + comments + saves + shares) in the current period. |
sum_curr_post_reactions | Sum Curr Post Reactions | Metric | Total likes on posts in the current period. |
sum_curr_post_comments | Sum Curr Post Comments | Metric | Total comments on posts in the current period. |
sum_curr_post_saves | Sum Curr Post Saves | Metric | Total saves on posts in the current period. |
sum_curr_post_reach | Sum Curr Post Reach | Metric | Unique accounts reached by posts in the current period. |
sum_curr_profile_impressions | Sum Curr Profile Impressions | Metric | Total profile-level impressions in the current period. |
sum_curr_post_views | Sum Curr Post Views | Metric | Total video/reel views on posts in the current period. |
sum_curr_total_stories | Sum Curr Total Stories | Metric | Stories published in the current period. |
sum_curr_profile_views | Sum Curr Profile Views | Metric | Total profile page visits in the current period. |
sum_curr_followers_count | Sum Curr Followers Count | Metric | Follower count at the end of the current period. |
sum_curr_follows_count | Sum Curr Follows Count | Metric | Number of accounts this profile follows at period end. |
sum_curr_accounts_engaged | Sum Curr Accounts Engaged | Metric | Unique accounts that engaged with the profile in the current period. |
sum_curr_profile_engagement | Sum Curr Profile Engagement | Metric | Total profile-level engagement actions in the current period. |
sum_curr_profile_reach | Sum Curr Profile Reach | Metric | Unique accounts that saw any profile content in the current period. |
sum_curr_eng_rate | Sum Curr Eng Rate | % | Engagement rate: total engagement ÷ reach × 100 for the current period. |
sum_prev_* | Sum Prev … | Metric | Same 17 metrics as above but for the previous period. |
▶Audience Growth (Daily) & Rollup
Daily follower count for trend charts; rollup gives period totals for scorecards.
Field ID | Display Name | Kind | Description |
|---|---|---|---|
audience_growth_followers | Audience Growth Followers | Metric | Cumulative follower count on this date. |
audience_growth_followers_daily | Audience Growth Followers Daily | Metric | Net new followers gained on this specific day. |
audience_growth_rollup_curr_follower_count | Rollup Curr Follower Count | Metric | Follower count at the end of the current period. |
audience_growth_rollup_curr_follower_gained | Rollup Curr Follower Gained | Metric | Net followers gained during the current period. |
audience_growth_rollup_prev_follower_count | Rollup Prev Follower Count | Metric | Follower count at the end of the previous period. |
audience_growth_rollup_prev_follower_gained | Rollup Prev Follower Gained | Metric | Net followers gained during the previous period. |
▶Publishing Behaviour (Daily) & Rollup
Daily posting performance for trend charts. Rollup is broken down by media type (IMAGE, VIDEO, CAROUSEL_ALBUM, REELS) — one row per type per period.
Field ID | Display Name | Kind | Description |
|---|---|---|---|
publishing_behaviour_total_posts | Total Posts | Metric | Posts published on this day. |
publishing_behaviour_likes | Likes | Metric | Likes on posts published this day. |
publishing_behaviour_comments | Comments | Metric | Comments on posts published this day. |
publishing_behaviour_saved | Saved | Metric | Saves on posts published this day. |
publishing_behaviour_engagement | Engagement | Metric | Total engagement on posts published this day. |
publishing_behaviour_reach | Reach | Metric | Unique accounts reached by posts on this day. |
publishing_behaviour_impressions | Impressions | Metric | Total impressions on posts published this day. |
publishing_behaviour_views | Views | Metric | Video/Reel views on posts published this day. |
pub_beh_rlu_media_type | Pub Beh Rlu Media Type | Dim | Media type for the rollup row (IMAGE, VIDEO, CAROUSEL_ALBUM, REELS). |
pub_beh_rlu_curr_total_posts | Rollup Curr Total Posts | Metric | Posts of this media type published in the current period. |
pub_beh_rlu_curr_likes | … Curr Likes | Metric | Likes on this media type in the current period. |
pub_beh_rlu_curr_comments | … Curr Comments | Metric | Comments on this media type in the current period. |
pub_beh_rlu_curr_saved | … Curr Saved | Metric | Saves on this media type in the current period. |
pub_beh_rlu_curr_engagement | … Curr Engagement | Metric | Total engagement on this media type in the current period. |
pub_beh_rlu_curr_reach | … Curr Reach | Metric | Reach for this media type in the current period. |
pub_beh_rlu_curr_views | … Curr Views | Metric | Views for this media type in the current period. |
pub_beh_rlu_prev_* | … Prev … | Metric | Same 7 metrics as above for the previous period. |
▶Stories Performance (Daily) & Rollup
Daily story metrics for trend charts; rollup for scorecards.
Field ID | Display Name | Kind | Description |
|---|---|---|---|
stories_performance_published_stories | Published Stories | Metric | Stories published on this day. |
stories_performance_story_impressions | Story Impressions | Metric | Total story impressions on this day. |
stories_performance_avg_story_impressions | Avg Story Impressions | Metric | Average impressions per story on this day. |
stories_performance_story_reach | Story Reach | Metric | Unique accounts that viewed stories on this day. |
stories_performance_story_reply | Story Replies | Metric | Replies sent to stories on this day. |
stories_performance_story_exits | Story Exits | Metric | Number of times viewers exited the story on this day. |
stories_performance_story_taps_forward | Story Taps Forward | Metric | Forward taps (skips to next story) on this day. |
stories_performance_story_taps_back | Story Taps Back | Metric | Back taps (replay previous story) on this day. |
stories_rollup_curr_* | Rollup Curr … | Metric | Period total for each of the 8 story metrics above (current period). |
stories_rollup_prev_* | Rollup Prev … | Metric | Period total for each of the 8 story metrics above (previous period). |
▶Reels (Daily) & Rollup
Daily Reels metrics for trend charts; rollup for scorecards.
Field ID | Display Name | Kind | Description |
|---|---|---|---|
reels_total_posts | Reels Total Posts | Metric | Reels published on this day. |
reels_engagement | Reels Engagement | Metric | Total engagement on Reels this day. |
reels_likes | Reels Likes | Metric | Likes on Reels this day. |
reels_comments | Reels Comments | Metric | Comments on Reels this day. |
reels_saves | Reels Saves | Metric | Saves on Reels this day. |
reels_shares | Reels Shares | Metric | Shares of Reels this day. |
reels_avg_watch_time | Reels Avg Watch Time | Metric | Average seconds watched per Reel play on this day. |
reels_total_watch_time | Reels Total Watch Time | Metric | Total seconds watched across all Reels on this day. |
reels_rollup_curr_* | Reels Rollup Curr … | Metric | Period total for each of the 8 Reels metrics above (current period). |
reels_rollup_prev_* | Reels Rollup Prev … | Metric | Period total for each of the 8 Reels metrics above (previous period). |
▶Top Hashtags & Rollup
One row per hashtag used in the period. Rollup gives overall hashtag activity totals for scorecards.
Field ID | Display Name | Kind | Description |
|---|---|---|---|
top_hashtags_name | Top Hashtags Name | Dim | The hashtag text (without #). |
top_hashtags_posts | Top Hashtags Posts | Metric | Number of posts using this hashtag. |
top_hashtags_engagement | Top Hashtags Engagement | Metric | Total engagement on posts using this hashtag. |
top_hashtags_likes | Top Hashtags Likes | Metric | Likes on posts using this hashtag. |
top_hashtags_comments | Top Hashtags Comments | Metric | Comments on posts using this hashtag. |
top_hashtags_saved | Top Hashtags Saved | Metric | Saves on posts using this hashtag. |
top_hashtags_rollup_curr_total_engagement | Rollup Curr Total Engagement | Metric | Total engagement across all hashtagged posts in the current period. |
top_hashtags_rollup_curr_total_unique_hashtags | Rollup Curr Total Unique Hashtags | Metric | Number of distinct hashtags used in the current period. |
top_hashtags_rollup_curr_total_hashtag_uses | Rollup Curr Total Hashtag Uses | Metric | Total hashtag instances (a post with 5 hashtags counts as 5) in the current period. |
top_hashtags_rollup_prev_* | Rollup Prev … | Metric | Same 6 rollup metrics for the previous period. |
▶Impressions & Engagement (Daily + Rollup)
Daily impressions and engagement for trend charts, plus rollup totals for scorecards.
Field ID | Display Name | Kind | Description |
|---|---|---|---|
impressions_impressions | Impressions | Metric | Total profile impressions on this day. |
impressions_rollup_curr_total_impressions | Rollup Curr Total Impressions | Metric | Total impressions for the current period. |
impressions_rollup_curr_avg_impressions | Rollup Curr Avg Impressions | Metric | Average daily impressions in the current period. |
impressions_rollup_prev_* | Rollup Prev … | Metric | Same 2 rollup metrics for the previous period. |
engagements_engagement | Engagements Engagement | Metric | Total engagement actions on this day. |
engagements_comments | Engagements Comments | Metric | Comments received on this day. |
engagements_reactions | Engagements Reactions | Metric | Reactions (likes) received on this day. |
engagements_rollup_curr_engagement | Rollup Curr Engagement | Metric | Total engagement for the current period. |
engagements_rollup_curr_avg_engagement | Rollup Curr Avg Engagement | Metric | Average daily engagement in the current period. |
engagements_rollup_curr_saved | Rollup Curr Saved | Metric | Total saves in the current period. |
engagements_rollup_curr_count | Rollup Curr Count | Metric | Number of posts with engagement data in the current period. |
engagements_rollup_prev_* | Rollup Prev … | Metric | Same 6 rollup engagement metrics for the previous period. |
▶Active Users (Days & Hours)
Audience activity heatmap data. Use in bar charts — active_users_days_buckets or active_users_hours_buckets as the dimension.
Field ID | Display Name | Kind | Description |
|---|---|---|---|
active_users_days_buckets | Active Users Days Buckets | Dim | Day of week (Monday–Sunday). |
active_users_days_values | Active Users Days Values | Metric | Relative follower activity level for this day. |
active_users_days_highest_value | Highest Day Value | Metric | Peak activity value across all days (repeated on each row). |
active_users_days_highest_day | Highest Day | Dim | Most active day of the week (repeated on each row). |
active_users_hours_buckets | Active Users Hours Buckets | Metric | Hour of day (0–23). |
active_users_hours_values | Active Users Hours Values | Metric | Relative follower activity level for this hour. |
active_users_hours_highest_value | Highest Hour Value | Metric | Peak activity value across all hours (repeated on each row). |
active_users_hours_highest_hour | Highest Hour | Metric | Most active hour of the day (repeated on each row). |
▶Top Posts
One row per post (top 100 by views). Use in a table or gallery chart.
Field ID | Display Name | Kind | Description |
|---|---|---|---|
top_posts_post_created_at | Post Created At | Dim | Date the post was published. |
top_posts_instagram_id | Instagram ID | Dim | Instagram account identifier. |
top_posts_media_id | Media ID | Dim | Unique Instagram media identifier for this post. |
top_posts_caption | Caption | Dim | Post caption text. |
top_posts_media_type | Media Type | Dim | Content type (IMAGE, VIDEO, CAROUSEL_ALBUM, REELS). |
top_posts_entity_type | Entity Type | Dim | Post entity category (post, story, reel). |
top_posts_media_url | Media URL | Dim | Direct URL(s) of the media file, comma-joined for carousels. |
top_posts_permalink | Permalink | Dim | Permanent URL of the post on Instagram. |
top_posts_hashtags | Hashtags | Dim | Comma-joined hashtags used in the caption. |
top_posts_day_of_week | Day Of Week | Dim | Day of week the post was published. |
top_posts_hour_of_day | Hour Of Day | Metric | Hour (0–23) the post was published. |
top_posts_like_count | Like Count | Metric | Total likes on the post. |
top_posts_comments_count | Comments Count | Metric | Total comments on the post. |
top_posts_saved | Saved | Metric | Times the post was saved. |
top_posts_engagement | Engagement | Metric | Total engagement (likes + comments + saves + shares). |
top_posts_reach | Reach | Metric | Unique accounts that saw this post. |
top_posts_impressions | Impressions | Metric | Total times this post was displayed. |
top_posts_views | Views | Metric | Total video/reel play count. |
top_posts_reels_avg_watch_time | Reels Avg Watch Time | Metric | Average seconds watched per Reel play (Reels only). |
top_posts_exits | Exits | Metric | Times viewers exited from this story (Stories only). |
top_posts_replies | Replies | Metric | Replies to this story (Stories only). |
▶Demographics — Age, Gender, Location
One row per demographic bucket. Use in pie or bar charts.
Field ID | Display Name | Kind | Description |
|---|---|---|---|
audience_age_bracket | Age Bracket | Dim | Age range (e.g. "18-24", "35-44"). |
audience_age_count | Age Count | Metric | Number of followers in this age bracket. |
audience_gender_gender | Gender | Dim | Gender segment (F, M, U). |
audience_gender_count | Gender Count | Metric | Followers in this gender segment. |
audience_city_city | City | Dim | City of followers. |
audience_city_count | City Count | Metric | Followers from this city. |
audience_country_country | Country | Dim | Country of followers. |
audience_country_count | Country Count | Metric | Followers from this country. |
▶Summary
Single-row response with current & previous period totals for LinkedIn page and post metrics.
Field ID | Display Name | Kind | Description |
|---|---|---|---|
period | Period | Dim | Always "Current" — row identifier for single-row scorecard sources. |
sum_curr_followers | Sum Curr Followers | Metric | Follower count at the end of the current period. |
sum_curr_total_posts | Sum Curr Total Posts | Metric | Posts published in the current period. |
sum_curr_post_likes | Sum Curr Post Likes | Metric | Total likes on posts in the current period. |
sum_curr_post_comments | Sum Curr Post Comments | Metric | Total comments on posts in the current period. |
sum_curr_post_shares | Sum Curr Post Shares | Metric | Total shares on posts in the current period. |
sum_curr_post_clicks | Sum Curr Post Clicks | Metric | Total link/content clicks on posts in the current period. |
sum_curr_total_engagement | Sum Curr Total Engagement | Metric | Sum of all engagement actions (likes + comments + shares + clicks) in the current period. |
sum_curr_engagement_rate | Sum Curr Engagement Rate | % | Page-level engagement rate for the current period. |
sum_curr_post_engagement_rate | Sum Curr Post Engagement Rate | % | Post-level engagement rate for the current period. |
sum_curr_page_impressions | Sum Curr Page Impressions | Metric | Total page-level impressions in the current period. |
sum_curr_page_reach | Sum Curr Page Reach | Metric | Unique members who saw page content in the current period. |
sum_curr_page_views | Sum Curr Page Views | Metric | Total page visits in the current period. |
sum_curr_page_unique_visitors | Sum Curr Page Unique Visitors | Metric | Unique visitors to the page in the current period. |
sum_prev_* | Sum Prev … | Metric | Same 16 metrics as above for the previous period. |
▶Audience Growth (Daily) & Rollup
Daily organic and paid follower growth for trend charts; rollup for scorecards.
Field ID | Display Name | Kind | Description |
|---|---|---|---|
audience_growth_total_follower_count | Total Follower Count | Metric | Cumulative total follower count on this date. |
audience_growth_total_followers_daily | Total Followers Daily | Metric | Net new followers (organic + paid) on this day. |
audience_growth_organic_follower_count | Organic Follower Count | Metric | Cumulative organic follower count on this date. |
audience_growth_organic_followers_daily | Organic Followers Daily | Metric | Organic new followers gained on this day. |
audience_growth_paid_follower_count | Paid Follower Count | Metric | Cumulative paid follower count on this date. |
audience_growth_paid_followers_daily | Paid Followers Daily | Metric | Paid new followers gained on this day. |
audience_growth_rollup_curr_total_follower_count | Rollup Curr Total Followers | Metric | Total follower count at the end of the current period. |
audience_growth_rollup_curr_organic_follower_count | Rollup Curr Organic Followers | Metric | Organic follower count at the end of the current period. |
audience_growth_rollup_curr_paid_follower_count | Rollup Curr Paid Followers | Metric | Paid follower count at the end of the current period. |
audience_growth_rollup_curr_avg_follower_count | Rollup Curr Avg Followers | Metric | Average daily follower count in the current period. |
audience_growth_rollup_prev_* | Rollup Prev … | Metric | Same 4 rollup metrics for the previous period. |
▶Publishing Behaviour (Daily) & Rollup
Daily posting and engagement metrics for trend charts. Rollup is broken down by media type — one row per type per period.
Field ID | Display Name | Kind | Description |
|---|---|---|---|
publishing_behaviour_total_posts | Total Posts | Metric | Posts published on this day. |
publishing_behaviour_impressions | Impressions | Metric | Total post impressions on this day. |
publishing_behaviour_engagement | Engagement | Metric | Total post engagement on this day. |
publishing_behaviour_likes | Likes | Metric | Total likes on posts this day. |
publishing_behaviour_comments | Comments | Metric | Total comments on posts this day. |
publishing_behaviour_shares | Shares | Metric | Total reshares of posts this day. |
publishing_behaviour_clicks | Clicks | Metric | Total link/content clicks on posts this day. |
publishing_behaviour_reach | Reach | Metric | Unique members reached by posts this day. |
publishing_behaviour_engagement_rate | Engagement Rate | % | Engagement rate for posts this day. |
pub_beh_rlu_media_type | Pub Beh Rlu Media Type | Dim | Media type for the rollup row (ARTICLE, IMAGE, VIDEO, etc.). |
pub_beh_rlu_curr_* | Rollup Curr … | Metric | Period totals per media type for the current period: total_posts, likes, comments, shares, clicks, engagements, impressions, reach. |
pub_beh_rlu_prev_* | Rollup Prev … | Metric | Same 8 rollup metrics for the previous period. |
▶Page Views (Daily) & Rollup
LinkedIn page visit data split by device type.
Field ID | Display Name | Kind | Description |
|---|---|---|---|
page_views_total_page_views_daily | Total Page Views Daily | Metric | Total page visits on this day. |
page_views_desktop_page_views_daily | Desktop Page Views Daily | Metric | Desktop page visits on this day. |
page_views_mobile_page_views_daily | Mobile Page Views Daily | Metric | Mobile page visits on this day. |
page_views_rollup_curr_total_page_views | Rollup Curr Total Page Views | Metric | Total page visits for the current period. |
page_views_rollup_curr_desktop_page_views | Rollup Curr Desktop Page Views | Metric | Desktop visits for the current period. |
page_views_rollup_curr_mobile_page_views | Rollup Curr Mobile Page Views | Metric | Mobile visits for the current period. |
page_views_rollup_curr_avg_page_views | Rollup Curr Avg Page Views | Metric | Average daily page visits in the current period. |
page_views_rollup_prev_* | Rollup Prev … | Metric | Same 4 rollup metrics for the previous period. |
▶Top Hashtags & Rollup
One row per hashtag. Rollup gives overall hashtag activity totals for scorecards.
Field ID | Display Name | Kind | Description |
|---|---|---|---|
hashtag | Hashtag | Dim | Hashtag text with # prefix (e.g. "#marketing"). |
top_hashtags_posts | Top Hashtags Posts | Metric | Posts using this hashtag. |
top_hashtags_engagements | Top Hashtags Engagements | Metric | Total engagement on posts using this hashtag. |
top_hashtags_likes | Top Hashtags Likes | Metric | Likes on posts using this hashtag. |
top_hashtags_comments | Top Hashtags Comments | Metric | Comments on posts using this hashtag. |
top_hashtags_shares | Top Hashtags Shares | Metric | Shares of posts using this hashtag. |
top_hashtags_rollup_curr_total_hashtags | Rollup Curr Total Hashtags | Metric | Unique hashtags used in the current period. |
top_hashtags_rollup_curr_total_times_used | Rollup Curr Total Times Used | Metric | Total hashtag instances in the current period. |
top_hashtags_rollup_curr_total_engagement | Rollup Curr Total Engagement | Metric | Total engagement on hashtagged posts in the current period. |
top_hashtags_rollup_curr_total_impressions | Rollup Curr Total Impressions | Metric | Total impressions on hashtagged posts in the current period. |
top_hashtags_rollup_curr_total_reach | Rollup Curr Total Reach | Metric | Total reach of hashtagged posts in the current period. |
top_hashtags_rollup_prev_* | Rollup Prev … | Metric | Same 8 rollup metrics for the previous period. |
▶Top Posts
One row per post (top 50 by total engagement). Use in a table chart.
Field ID | Display Name | Kind | Description |
|---|---|---|---|
top_posts_published_at | Published At | Dim | Date the post was published. |
top_posts_linkedin_id | LinkedIn ID | Dim | LinkedIn page identifier. |
top_posts_post_id | Post ID | Dim | Unique LinkedIn post URN. |
top_posts_activity | Activity | Dim | Post activity type (ARTICLE, IMAGE_SHARE, VIDEO, etc.). |
top_posts_media_type | Media Type | Dim | Media format of the post. |
top_posts_title | Title | Dim | Post title or headline. |
top_posts_hashtags | Hashtags | Dim | Comma-joined hashtags used in the post. |
top_posts_image | Image | Dim | URL of the post's primary image. |
top_posts_article_url | Article URL | Dim | URL of the linked article (for article shares). |
top_posts_day_of_week | Day Of Week | Dim | Day of week the post was published. |
top_posts_hour_of_day | Hour Of Day | Metric | Hour (0–23) the post was published. |
top_posts_favorites | Favorites (Likes) | Metric | Total likes/reactions on the post. |
top_posts_comments | Comments | Metric | Total comments on the post. |
top_posts_total_engagement | Total Engagement | Metric | Sum of all engagement actions on the post. |
top_posts_reach | Reach | Metric | Unique members who saw the post. |
top_posts_repost | Repost | Metric | Number of times the post was reshared. |
top_posts_post_clicks | Post Clicks | Metric | Link clicks on the post. |
top_posts_impressions | Impressions | Metric | Total post impressions. |
▶Posts Per Day (Day of Week)
Posting frequency by day of week. Use in a bar chart with day_of_week as the dimension.
Field ID | Display Name | Kind | Description |
|---|---|---|---|
day_of_week | Day of Week | Dim | Day name (Monday–Sunday). |
posts_per_days_posts | Posts Per Days Posts | Metric | Number of posts published on this day of week in the selected period. |
▶Follower Demographics
Audience breakdown by country, city, industry, and seniority. Each row represents one demographic bucket. Use in bar or pie charts — filter by follower_demographics_category to isolate a breakdown type.
Field ID | Display Name | Kind | Description |
|---|---|---|---|
follower_demographics_category | Category | Dim | Demographic type: "country", "city", "industry", or "seniority". |
follower_demographics_label | Label | Dim | The bucket label within the category (e.g. "United States", "Marketing"). |
follower_demographics_country | Country | Dim | Country value — populated only when category = "country". |
follower_demographics_city | City | Dim | City value — populated only when category = "city". |
follower_demographics_industry | Industry | Dim | Industry label — populated only when category = "industry". |
follower_demographics_seniority | Seniority | Dim | Seniority label (e.g. "Senior", "Manager") — populated only when category = "seniority". |
follower_demographics_count | Count | Metric | Number of followers in this demographic bucket. |
YouTube
▶Summary
Single-row response. Four sub-sections: summ_curr_*, summ_prev_*, summ_perc_*, summ_diff_*. The API field videos is aliased to *_total_posts in the connector.
Field ID | Display Name | Kind | Description |
|---|---|---|---|
period | Period | Dim | Always "Current" — row identifier for single-row scorecard sources. |
account_name | Account Name | Dim | YouTube channel name resolved from the account ID. |
summ_curr_subscribers | Summ Curr Subscribers | Metric | Total subscribers at the end of the current period. |
summ_curr_total_posts | Summ Curr Total Videos | Metric | Videos published in the current period (API field: |
summ_curr_views | Summ Curr Views | Metric | Total video views in the current period. |
summ_curr_watch_time | Summ Curr Watch Time (min) | Metric | Total watch time in minutes in the current period. |
summ_curr_avg_view_duration | Summ Curr Avg View Duration (s) | Metric | Average view duration in seconds for the current period. |
summ_curr_likes | Summ Curr Likes | Metric | Total likes in the current period. |
summ_curr_dislikes | Summ Curr Dislikes | Metric | Total dislikes in the current period. |
summ_curr_comments | Summ Curr Comments | Metric | Total comments in the current period. |
summ_curr_shares | Summ Curr Shares | Metric | Total shares in the current period. |
summ_curr_engagement | Summ Curr Engagement | Metric | Total engagement in the current period. |
summ_prev_subscribers | Summ Prev Subscribers | Metric | Subscribers at the end of the previous period. |
summ_prev_total_posts | Summ Prev Total Videos | Metric | Videos published in the previous period. |
summ_prev_views | Summ Prev Views | Metric | Total video views in the previous period. |
summ_prev_watch_time | Summ Prev Watch Time (min) | Metric | Total watch time in minutes in the previous period. |
summ_prev_avg_view_duration | Summ Prev Avg View Duration (s) | Metric | Average view duration in seconds for the previous period. |
summ_prev_likes | Summ Prev Likes | Metric | Total likes in the previous period. |
summ_prev_dislikes | Summ Prev Dislikes | Metric | Total dislikes in the previous period. |
summ_prev_comments | Summ Prev Comments | Metric | Total comments in the previous period. |
summ_prev_shares | Summ Prev Shares | Metric | Total shares in the previous period. |
summ_prev_engagement | Summ Prev Engagement | Metric | Total engagement in the previous period. |
summ_perc_subscribers | Summ Perc Subscribers | % | % change in subscribers vs previous period. |
summ_perc_total_posts | Summ Perc Total Videos | % | % change in videos published. |
summ_perc_views | Summ Perc Views | % | % change in views. |
summ_perc_watch_time | Summ Perc Watch Time | % | % change in watch time. |
summ_perc_avg_view_duration | Summ Perc Avg View Duration | % | % change in average view duration. |
summ_perc_likes | Summ Perc Likes | % | % change in likes. |
summ_perc_dislikes | Summ Perc Dislikes | % | % change in dislikes. |
summ_perc_comments | Summ Perc Comments | % | % change in comments. |
summ_perc_shares | Summ Perc Shares | % | % change in shares. |
summ_perc_engagement | Summ Perc Engagement | % | % change in engagement. |
summ_diff_subscribers | Summ Diff Subscribers | Metric | Absolute change in subscribers (current − previous). |
summ_diff_total_posts | Summ Diff Total Videos | Metric | Absolute change in videos published. |
summ_diff_views | Summ Diff Views | Metric | Absolute change in views. |
summ_diff_watch_time | Summ Diff Watch Time | Metric | Absolute change in watch time. |
summ_diff_avg_view_duration | Summ Diff Avg View Duration | Metric | Absolute change in average view duration. |
summ_diff_likes | Summ Diff Likes | Metric | Absolute change in likes. |
summ_diff_dislikes | Summ Diff Dislikes | Metric | Absolute change in dislikes. |
summ_diff_comments | Summ Diff Comments | Metric | Absolute change in comments. |
summ_diff_shares | Summ Diff Shares | Metric | Absolute change in shares. |
summ_diff_engagement | Summ Diff Engagement | Metric | Absolute change in engagement. |
▶Subscriber Trend (Daily)
One row per day. Use with date dimension in time-series charts. API endpoint: subscriberTrend.
Field ID | Display Name | Kind | Description |
|---|---|---|---|
date | Date | Dim | Day of the data point (YYYYMMDD). |
subscriber_trend_subscribers_gained_daily | Subscriber Trend Gained Daily | Metric | Net subscribers gained on this day. |
subscriber_trend_subscribers_total | Subscriber Trend Total | Metric | Cumulative subscriber count on this day. |
▶Dynamic Subscriber Trend
Supports daily/monthly aggregation via trend_type param. The API decides the final aggregation_level returned. API endpoint: subscriberTrendDaily.
Field ID | Display Name | Kind | Description |
|---|---|---|---|
date | Date | Dim | Day or month of the data point (YYYYMMDD). |
dynamic_subscriber_trend_aggregation_level | Dynamic Sub Trend Aggregation Level | Dim | Bucket granularity returned by the API (e.g. "daily", "monthly") — repeated on every row. |
dynamic_subscriber_trend_subscribers_gained_daily | Dynamic Sub Trend Gained Daily | Metric | Net subscribers gained in this bucket. |
dynamic_subscriber_trend_subscribers_total | Dynamic Sub Trend Total | Metric | Cumulative subscriber count at the end of this bucket. |
▶Engagement Trend
One row per day. *_daily fields are per-day deltas; *_total fields are cumulative running totals. API endpoint: engagementTrend.
Field ID | Display Name | Kind | Description |
|---|---|---|---|
date | Date | Dim | Day of the data point. |
eng_trend_like_daily | Eng Trend Likes Daily | Metric | Likes on this day. |
eng_trend_dislike_daily | Eng Trend Dislikes Daily | Metric | Dislikes on this day. |
eng_trend_share_daily | Eng Trend Shares Daily | Metric | Shares on this day. |
eng_trend_comment_daily | Eng Trend Comments Daily | Metric | Comments on this day. |
eng_trend_engagement_daily | Eng Trend Engagement Daily | Metric | Total engagement on this day. |
eng_trend_like_total | Eng Trend Likes Total | Metric | Cumulative likes up to and including this day. |
eng_trend_dislike_total | Eng Trend Dislikes Total | Metric | Cumulative dislikes. |
eng_trend_share_total | Eng Trend Shares Total | Metric | Cumulative shares. |
eng_trend_comment_total | Eng Trend Comments Total | Metric | Cumulative comments. |
eng_trend_engagement_total | Eng Trend Engagement Total | Metric | Cumulative total engagement. |
▶Views Trend
Daily video view breakdown by subscriber status. *_daily fields are per-day; *_total fields are cumulative. API endpoint: viewsTrend.
Field ID | Display Name | Kind | Description |
|---|---|---|---|
date | Date | Dim | Day of the data point. |
views_trend_subscriber_views_daily | Views Trend Subscriber Views Daily | Metric | Views from subscribers on this day. |
views_trend_non_subscriber_views_daily | Views Trend Non-Subscriber Views Daily | Metric | Views from non-subscribers on this day. |
views_trend_video_views_daily | Views Trend Video Views Daily | Metric | Total video views on this day. |
views_trend_subscriber_views_total | Views Trend Subscriber Views Total | Metric | Cumulative subscriber views. |
views_trend_non_subscriber_views_total | Views Trend Non-Subscriber Views Total | Metric | Cumulative non-subscriber views. |
views_trend_video_views_total | Views Trend Video Views Total | Metric | Cumulative total video views. |
▶Watch Time Trend
wt_average_watch_time is a per-day metric (not a global scalar). To get the period average in a scorecard, aggregate over the date range. API endpoint: watchTimeTrend.
Field ID | Display Name | Kind | Description |
|---|---|---|---|
date | Date | Dim | Day of the data point. |
wt_subscriber_watch_time_daily | WT Subscriber Watch Time Daily | Metric | Watch time (minutes) from subscribers on this day. |
wt_non_subscriber_watch_time_daily | WT Non-Subscriber Watch Time Daily | Metric | Watch time (minutes) from non-subscribers on this day. |
wt_average_watch_time | WT Average Watch Time | Metric | Average watch time per view on this day. |
wt_subscriber_watch_time_total | WT Subscriber Watch Time Total | Metric | Cumulative subscriber watch time. |
wt_non_subscriber_watch_time_total | WT Non-Subscriber Watch Time Total | Metric | Cumulative non-subscriber watch time. |
▶Video Discovery (Traffic Sources)
One row per traffic source (e.g. "YouTube Search", "External", "Suggested"). API endpoint: findVideo.
Field ID | Display Name | Kind | Description |
|---|---|---|---|
find_video_traffic_source | Find Video Traffic Source | Dim | Name of the traffic source (from |
find_video_source_value | Find Video Source Value | Metric | View count from this source. |
find_video_source_perc | Find Video Source % | % | Percentage of total views from this source. |
▶Video Sharing
One row per sharing platform (e.g. "Twitter", "WhatsApp", "Facebook"). Uses video_sharing_platform as the discriminating dimension to distinguish it from Video Discovery in connector routing. API endpoint: videoSharing.
Field ID | Display Name | Kind | Description |
|---|---|---|---|
video_sharing_platform | Video Sharing Platform | Dim | Platform the video was shared to (from |
video_sharing_source_value | Video Sharing Source Value | Metric | Share count for this platform. |
video_sharing_source_perc | Video Sharing Source % | % | Percentage of total shares to this platform. |
▶Top Posts
One row per video (top 15 by views). API endpoint: sortedTopPosts?limit=15&order_by=views.
Field ID | Display Name | Kind | Description |
|---|---|---|---|
date | Date | Dim | Date the video was published (from |
top_posts_video_id | Top Post Video ID | Dim | YouTube video ID (API field: |
top_posts_video_title | Top Post Video Title | Dim | Video title. |
top_posts_permalink | Top Post Video URL | Dim | Direct URL to the video (API field: |
top_posts_video_description | Top Post Video Description | Dim | Video description. |
top_posts_video_thumbnail_url | Top Post Thumbnail URL | Dim | Thumbnail image URL. |
top_posts_video_media_type | Top Post Media Type | Dim | Media type of the video. |
top_posts_video_embed_url | Top Post Embed URL | Dim | Iframe embed URL (API field: |
top_posts_like_count | Top Post Likes | Metric | Total likes on the video. |
top_posts_dislike_count | Top Post Dislikes | Metric | Total dislikes on the video. |
top_posts_comments_count | Top Post Comments | Metric | Total comments on the video (API field: |
top_posts_video_views | Top Post Views | Metric | Total views (API field: |
top_posts_minutes_watched | Top Post Minutes Watched | Metric | Total minutes watched. |
top_posts_video_avg_duration | Top Post Avg View Duration (s) | Metric | Average view duration in seconds (API field: |
top_posts_engagement_rate | Top Post Engagement Rate | % | Engagement rate for the video. |
top_posts_video_duration | Top Post Video Duration (s) | Metric | Total video duration in seconds. |
top_posts_video_engagement | Top Post Video Engagement | Metric | Total engagement actions (API field: |
top_posts_video_red_views | Top Post Red Views | Metric | YouTube Premium (Red) views. |
top_posts_video_favorites | Top Post Favorites | Metric | Times the video was added to a favorites playlist. |
top_posts_video_subscribers_gained | Top Post Subscribers Gained | Metric | Subscribers gained from this video. |
top_posts_video_shares | Top Post Shares | Metric | Times the video was shared (API field: |
top_posts_video_red_minutes_watched | Top Post Red Minutes Watched | Metric | YouTube Premium minutes watched. |
top_posts_video_avg_view_percentage | Top Post Avg View Percentage | % | Average percentage of the video watched (API field: |
▶Least Posts
Videos sorted by lowest performance. Two arrays concatenated: ordered by views and by engagement. least_posts_sort_by indicates which list produced each row. API endpoint: leastPosts.
Field ID | Display Name | Kind | Description |
|---|---|---|---|
least_posts_sort_by | Least Posts Sort By | Dim | "views" or "engagement" — indicates the sort order that produced this row. |
date | Date | Dim | Date the video was published. |
least_posts_video_id | Least Post Video ID | Dim | YouTube video ID. |
least_posts_video_title | Least Post Video Title | Dim | Video title. |
least_posts_permalink | Least Post Video URL | Dim | Direct URL to the video. |
least_posts_video_description | Least Post Video Description | Dim | Video description. |
least_posts_video_thumbnail_url | Least Post Thumbnail URL | Dim | Thumbnail image URL. |
least_posts_video_media_type | Least Post Media Type | Dim | Media type of the video. |
least_posts_video_embed_url | Least Post Embed URL | Dim | Iframe embed URL. |
least_posts_like_count | Least Post Likes | Metric | Total likes on the video. |
least_posts_dislike_count | Least Post Dislikes | Metric | Total dislikes on the video. |
least_posts_comments_count | Least Post Comments | Metric | Total comments on the video. |
least_posts_video_views | Least Post Views | Metric | Total views. |
least_posts_minutes_watched | Least Post Min Watched | Metric | Total minutes watched. |
least_posts_video_avg_duration | Least Post Avg Duration | Metric | Average view duration in seconds. |
least_posts_engagement_rate | Least Post Eng Rate | % | Engagement rate for the video. |
least_posts_video_duration | Least Post Video Duration (s) | Metric | Total video duration in seconds. |
least_posts_video_engagement | Least Post Video Engagement | Metric | Total engagement actions. |
least_posts_video_red_views | Least Post Red Views | Metric | YouTube Premium views. |
least_posts_video_favorites | Least Post Favorites | Metric | Favorites playlist additions. |
least_posts_video_subscribers_gained | Least Post Subscribers Gained | Metric | Subscribers gained from this video. |
least_posts_video_shares | Least Post Shares | Metric | Times the video was shared. |
least_posts_video_red_minutes_watched | Least Post Red Minutes Watched | Metric | YouTube Premium minutes watched. |
least_posts_video_avg_view_percentage | Least Post Avg View Percentage | % | Average percentage of the video watched. |
▶Performance & Schedule
One row per day combining posting behaviour and view breakdown by subscriber status. All fields use the ps_ prefix to prevent routing collision with other date-based groups. API endpoint: performanceSchedule.
Field ID | Display Name | Kind | Description |
|---|---|---|---|
date | Date | Dim | Day of the data point. |
ps_count | PS Post Count | Metric | Videos posted on this day (from |
ps_likes | PS Likes | Metric | Total likes on videos posted this day. |
ps_dislikes | PS Dislikes | Metric | Total dislikes on videos posted this day. |
ps_shares | PS Shares | Metric | Total shares on videos posted this day. |
ps_comments | PS Comments | Metric | Total comments on videos posted this day. |
ps_engagement | PS Engagement | Metric | Total engagement on this day. |
ps_sub_views | PS Subscriber Views | Metric | Views from subscribers on this day (from |
ps_non_sub_views | PS Non-Subscriber Views | Metric | Views from non-subscribers on this day (from |
TikTok
▶Dimensions
Field ID | Display Name | Kind | Description |
|---|---|---|---|
date | Date | Dim | Date. |
account_name | Account Name | Dim | Account Name. |
▶Summary
Field ID | Display Name | Kind | Description |
|---|---|---|---|
sum_curr_logo | Sum Curr Logo | Dim | Sum Curr Logo. |
sum_curr_page_name | Sum Curr Page Name | Dim | Sum Curr Page Name. |
▶Current period totals
Field ID | Display Name | Kind | Description |
|---|---|---|---|
sum_curr_total_followers | Sum Curr Total Followers | Metric | Sum Curr Total Followers. |
sum_curr_total_followings | Sum Curr Total Followings | Metric | Sum Curr Total Followings. |
sum_curr_total_posts | Sum Curr Total Posts | Metric | Sum Curr Total Posts. |
sum_curr_total_video_views | Sum Curr Total Video Views | Metric | Sum Curr Total Video Views. |
sum_curr_total_likes | Sum Curr Total Likes | Metric | Sum Curr Total Likes. |
sum_curr_total_comments | Sum Curr Total Comments | Metric | Sum Curr Total Comments. |
sum_curr_total_shares | Sum Curr Total Shares | Metric | Sum Curr Total Shares. |
sum_curr_total_engagements | Sum Curr Total Engagements | Metric | Sum Curr Total Engagements. |
▶Absolute diff
Field ID | Display Name | Kind | Description |
|---|---|---|---|
sum_curr_total_likes_diff | Sum Curr Total Likes Diff | Metric | Sum Curr Total Likes Diff. |
sum_curr_total_comments_diff | Sum Curr Total Comments Diff | Metric | Sum Curr Total Comments Diff. |
sum_curr_total_shares_diff | Sum Curr Total Shares Diff | Metric | Sum Curr Total Shares Diff. |
sum_curr_total_engagements_diff | Sum Curr Total Engagements Diff | Metric | Sum Curr Total Engagements Diff. |
sum_curr_total_posts_diff | Sum Curr Total Posts Diff | Metric | Sum Curr Total Posts Diff. |
sum_curr_total_followers_diff | Sum Curr Total Followers Diff | Metric | Sum Curr Total Followers Diff. |
sum_curr_total_video_views_diff | Sum Curr Total Video Views Diff | Metric | Sum Curr Total Video Views Diff. |
sum_curr_total_followings_diff | Sum Curr Total Followings Diff | Metric | Sum Curr Total Followings Diff. |
▶Percentage growth
Field ID | Display Name | Kind | Description |
|---|---|---|---|
sum_curr_total_likes_growth | Sum Curr Total Likes Growth % | % | Sum Curr Total Likes Growth %. |
sum_curr_total_comments_growth | Sum Curr Total Comments Growth % | % | Sum Curr Total Comments Growth %. |
sum_curr_total_shares_growth | Sum Curr Total Shares Growth % | % | Sum Curr Total Shares Growth %. |
sum_curr_total_engagements_growth | Sum Curr Total Engagements Growth % | % | Sum Curr Total Engagements Growth %. |
sum_curr_total_posts_growth | Sum Curr Total Posts Growth % | % | Sum Curr Total Posts Growth %. |
sum_curr_total_followers_growth | Sum Curr Total Followers Growth % | % | Sum Curr Total Followers Growth %. |
sum_curr_total_video_views_growth | Sum Curr Total Video Views Growth % | % | Sum Curr Total Video Views Growth %. |
sum_curr_total_followings_growth | Sum Curr Total Followings Growth % | % | Sum Curr Total Followings Growth %. |
▶Audience growth
Field ID | Display Name | Kind | Description |
|---|---|---|---|
data_display_name | Data Display Name | Dim | Data Display Name. |
data_followers_count | Data Followers Count | Metric | Data Followers Count. |
data_followers_count_diff | Data Followers Count Diff | Metric | Data Followers Count Diff. |
data_views_per_day | Data Views Per Day | Metric | Data Views Per Day. |
data_views_per_day_diff | Data Views Per Day Diff | Metric | Data Views Per Day Diff. |
▶Daily engagements
Field ID | Display Name | Kind | Description |
|---|---|---|---|
data_daily_video_likes | Data Daily Video Likes | Metric | Data Daily Video Likes. |
data_daily_video_comments | Data Daily Video Comments | Metric | Data Daily Video Comments. |
data_daily_video_shares | Data Daily Video Shares | Metric | Data Daily Video Shares. |
data_daily_engagement | Data Daily Engagement | Metric | Data Daily Engagement. |
data_total_video_likes | Data Total Video Likes | Metric | Data Total Video Likes. |
data_total_video_comments | Data Total Video Comments | Metric | Data Total Video Comments. |
data_total_video_shares | Data Total Video Shares | Metric | Data Total Video Shares. |
data_total_engagement | Data Total Engagement | Metric | Data Total Engagement. |
▶Posts & engagements
Field ID | Display Name | Kind | Description |
|---|---|---|---|
data_sum_view_count | Data Sum View Count | Metric | Data Sum View Count. |
data_sum_like_count | Data Sum Like Count | Metric | Data Sum Like Count. |
data_sum_comments_count | Data Sum Comments Count | Metric | Data Sum Comments Count. |
data_sum_share_count | Data Sum Share Count | Metric | Data Sum Share Count. |
data_sum_engagement_count | Data Sum Engagement Count | Metric | Data Sum Engagement Count. |
data_post_count | Data Post Count | Metric | Data Post Count. |
data_avg_engagement_rate | Data Avg Engagement Rate | % | Data Avg Engagement Rate. |
▶Top posts — dimensions
Field ID | Display Name | Kind | Description |
|---|---|---|---|
top_posts_created_at | Top Posts Created At | Dim | Top Posts Created At. |
top_posts_media_type | Top Posts Media Type | Dim | Top Posts Media Type. |
top_posts_permalink | Top Posts Permalink | Dim | Top Posts Permalink. |
top_posts_post_id | Top Posts Post ID | Dim | Top Posts Post ID. |
top_posts_title | Top Posts Title | Dim | Top Posts Title. |
top_posts_description | Top Posts Description | Dim | Top Posts Description. |
top_posts_cover_image_url | Top Posts Cover Image URL | Dim | Top Posts Cover Image URL. |
top_posts_embed_link | Top Posts Embed Link | Dim | Top Posts Embed Link. |
top_posts_profile_link | Top Posts Profile Link | Dim | Top Posts Profile Link. |
top_posts_hashtags | Top Posts Hashtags | Dim | Top Posts Hashtags. |
▶Top posts — metrics
Field ID | Display Name | Kind | Description |
|---|---|---|---|
top_posts_like_count | Top Posts Like Count | Metric | Top Posts Like Count. |
top_posts_comments_count | Top Posts Comments Count | Metric | Top Posts Comments Count. |
top_posts_views_count | Top Posts Views Count | Metric | Top Posts Views Count. |
top_posts_shares_count | Top Posts Shares Count | Metric | Top Posts Shares Count. |
top_posts_engagement | Top Posts Engagement | Metric | Top Posts Engagement. |
top_posts_engagement_rate | Top Posts Engagement Rate | % | Top Posts Engagement Rate. |
top_posts_follower_count | Top Posts Follower Count | Metric | Top Posts Follower Count. |
top_posts_duration | Top Posts Duration | Metric | Top Posts Duration. |
top_posts_height | Top Posts Height | Metric | Top Posts Height. |
top_posts_width | Top Posts Width | Metric | Top Posts Width. |
▶Least posts — dimensions
Field ID | Display Name | Kind | Description |
|---|---|---|---|
least_posts_created_at | Least Posts Created At | Dim | Least Posts Created At. |
least_posts_media_type | Least Posts Media Type | Dim | Least Posts Media Type. |
least_posts_permalink | Least Posts Permalink | Dim | Least Posts Permalink. |
least_posts_post_id | Least Posts Post ID | Dim | Least Posts Post ID. |
least_posts_title | Least Posts Title | Dim | Least Posts Title. |
least_posts_description | Least Posts Description | Dim | Least Posts Description. |
least_posts_cover_image_url | Least Posts Cover Image URL | Dim | Least Posts Cover Image URL. |
least_posts_embed_link | Least Posts Embed Link | Dim | Least Posts Embed Link. |
least_posts_profile_link | Least Posts Profile Link | Dim | Least Posts Profile Link. |
least_posts_hashtags | Least Posts Hashtags | Dim | Least Posts Hashtags. |
▶Least posts — metrics
Field ID | Display Name | Kind | Description |
|---|---|---|---|
least_posts_like_count | Least Posts Like Count | Metric | Least Posts Like Count. |
least_posts_comments_count | Least Posts Comments Count | Metric | Least Posts Comments Count. |
least_posts_views_count | Least Posts Views Count | Metric | Least Posts Views Count. |
least_posts_shares_count | Least Posts Shares Count | Metric | Least Posts Shares Count. |
least_posts_engagement | Least Posts Engagement | Metric | Least Posts Engagement. |
least_posts_engagement_rate | Least Posts Engagement Rate | % | Least Posts Engagement Rate. |
least_posts_follower_count | Least Posts Follower Count | Metric | Least Posts Follower Count. |
least_posts_duration | Least Posts Duration | Metric | Least Posts Duration. |
least_posts_height | Least Posts Height | Metric | Least Posts Height. |
least_posts_width | Least Posts Width | Metric | Least Posts Width. |
▶All posts
Field ID | Display Name | Kind | Description |
|---|---|---|---|
data_created_time | Data Created Time | Dim | Data Created Time. |
data_category | Data Category | Dim | Data Category. |
data_post_id | Data Post ID | Dim | Data Post ID. |
data_title | Data Title | Dim | Data Title. |
data_post_description | Data Post Description | Dim | Data Post Description. |
data_cover_image_url | Data Cover Image URL | Dim | Data Cover Image URL. |
data_embed_link | Data Embed Link | Dim | Data Embed Link. |
data_share_url | Data Share URL | Dim | Data Share URL. |
data_profile_link | Data Profile Link | Dim | Data Profile Link. |
data_hashtags | Data Hashtags | Dim | Data Hashtags. |
data_likes_count | Data Likes Count | Metric | Data Likes Count. |
data_comments_count | Data Comments Count | Metric | Data Comments Count. |
data_views_count | Data Views Count | Metric | Data Views Count. |
data_shares_count | Data Shares Count | Metric | Data Shares Count. |
data_engagements_count | Data Engagements Count | Metric | Data Engagements Count. |
data_engagement_rate | Data Engagement Rate | % | Data Engagement Rate. |
data_total_follower_count | Data Total Follower Count | Metric | Data Total Follower Count. |
data_total | Data Total | Metric | Data Total. |
data_duration | Data Duration | Metric | Data Duration. |
data_height | Data Height | Metric | Data Height. |
data_width | Data Width | Metric | Data Width. |
Option B — Use the pre-built template
The template gives you a professionally designed dashboard that is already set up with the most commonly needed social media KPIs. Your data fills in automatically.
On the Data Studio integration page in ContentStudio, click Try Template.
A dialog will open. Select your Workspace, Platform (Facebook, Instagram, or LinkedIn), and the Account you want to report on.
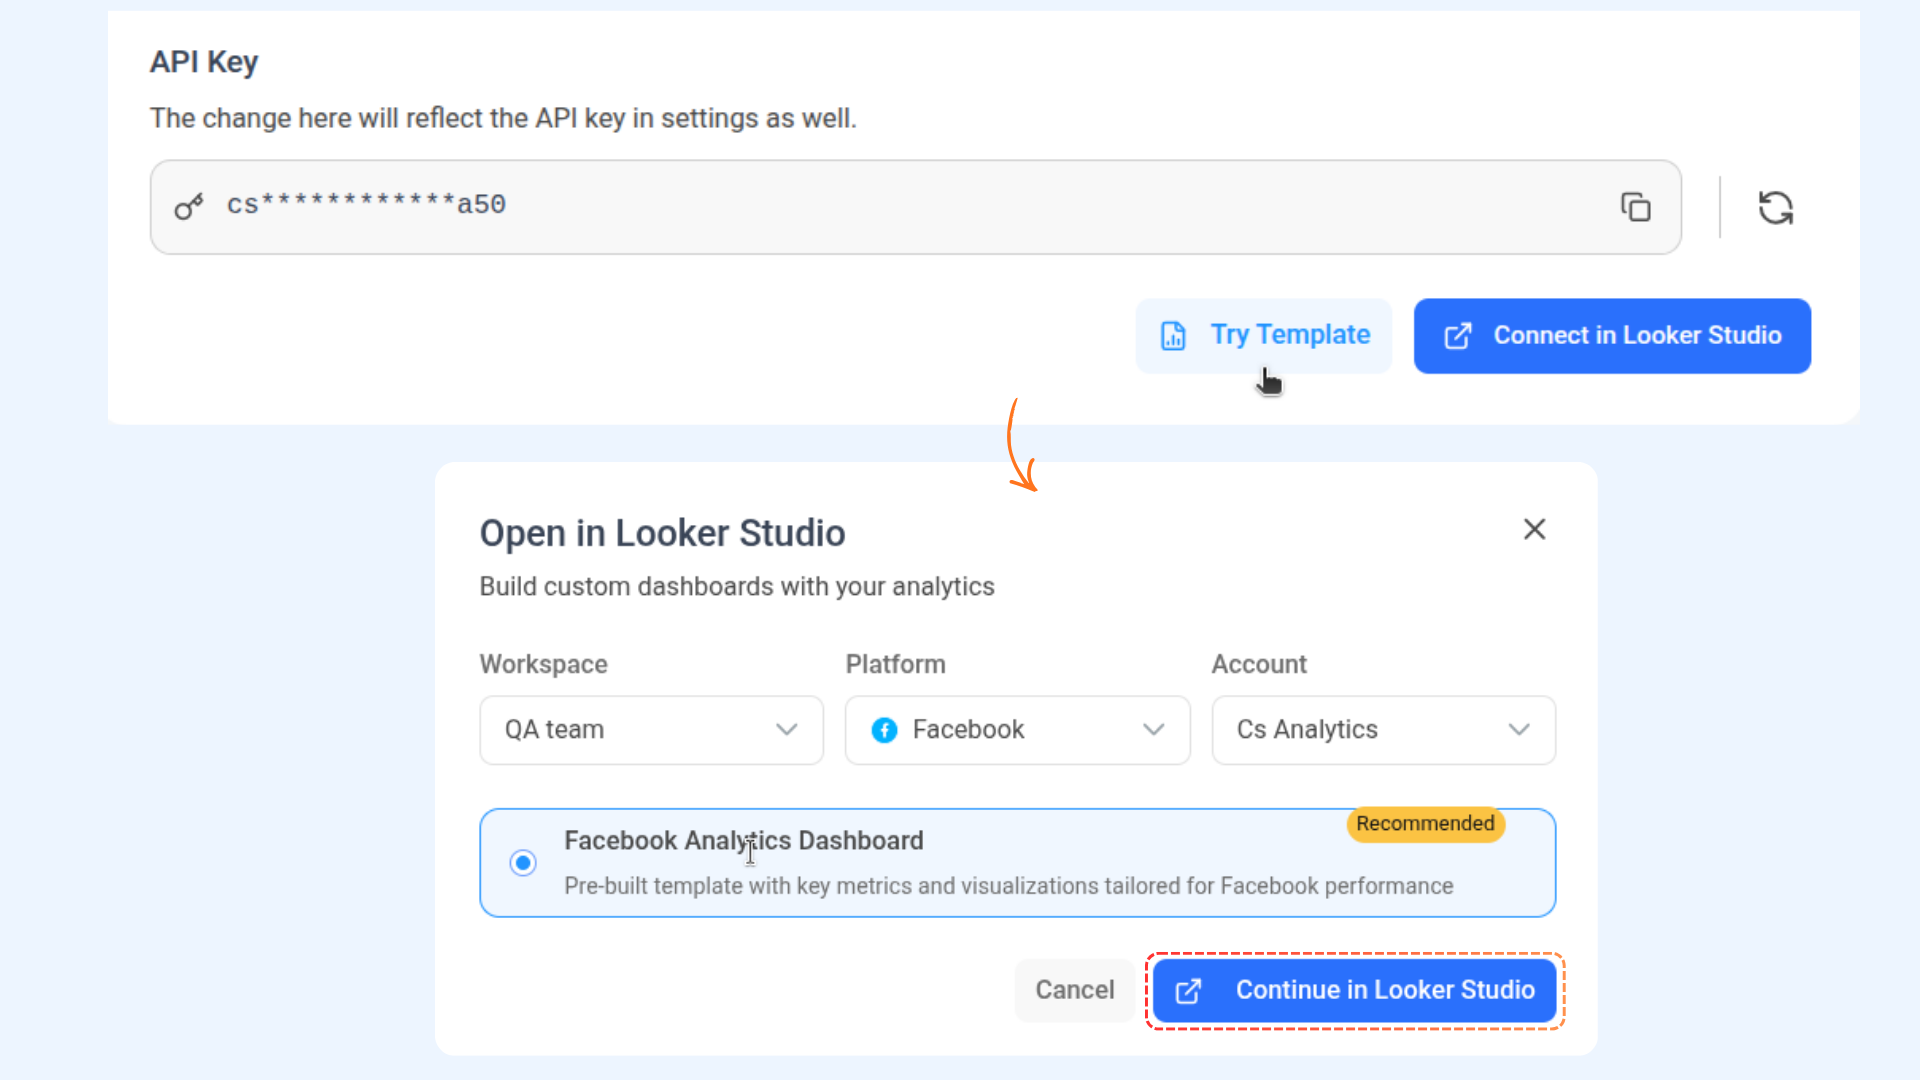
Click Continue in Data Studio. The pre-built template will open in Data Studio, already connected to your selected account.
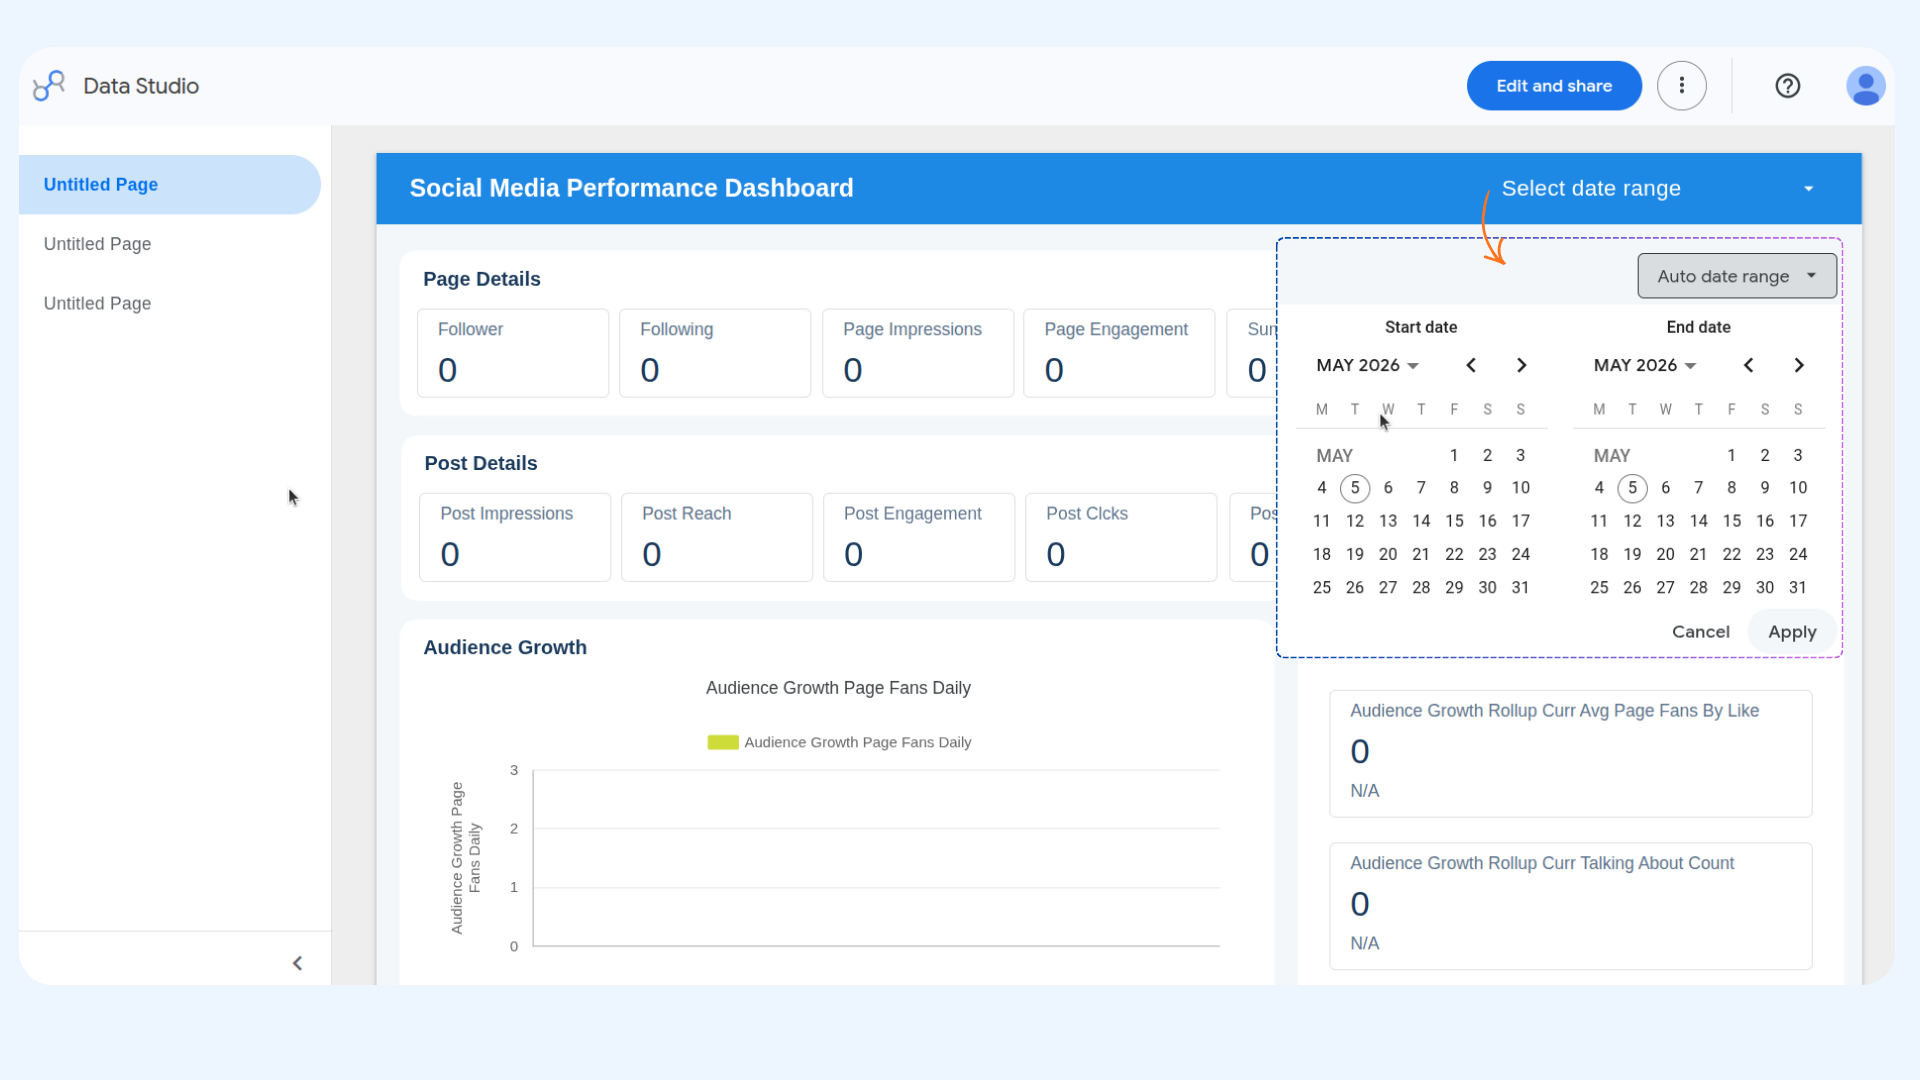
Your dashboard is ready. Use the date range filter at the top to view any time period, or click Edit to customise the layout further.
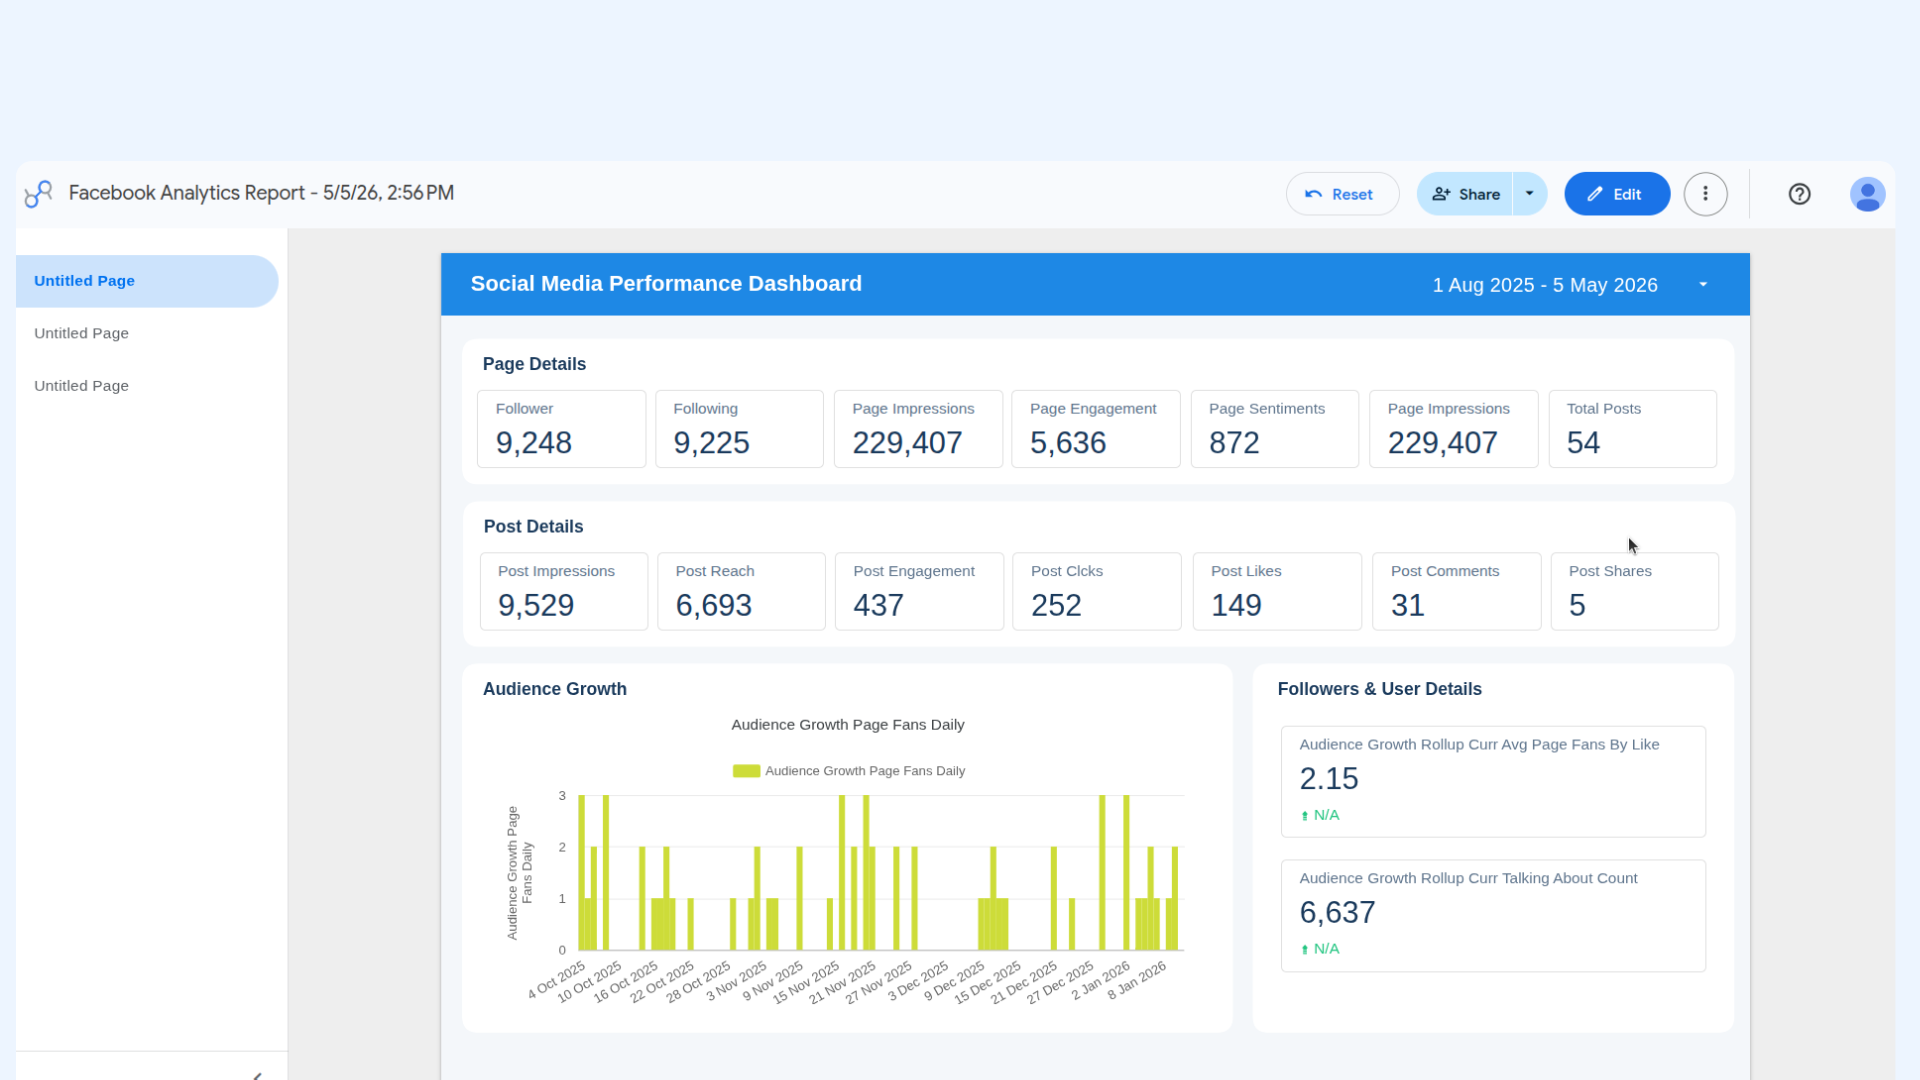
Opening Data Studio from a platform's analytics page
You can also connect to Data Studio directly from any individual platform's analytics page — Facebook, Instagram, or LinkedIn. This skips the setup steps because ContentStudio auto-detects your current workspace and account.
Open any platform's analytics page — go to Analytics and select Facebook, Instagram, or LinkedIn from the left sidebar.
In the top-right corner of the analytics page, click the Data Studio button.
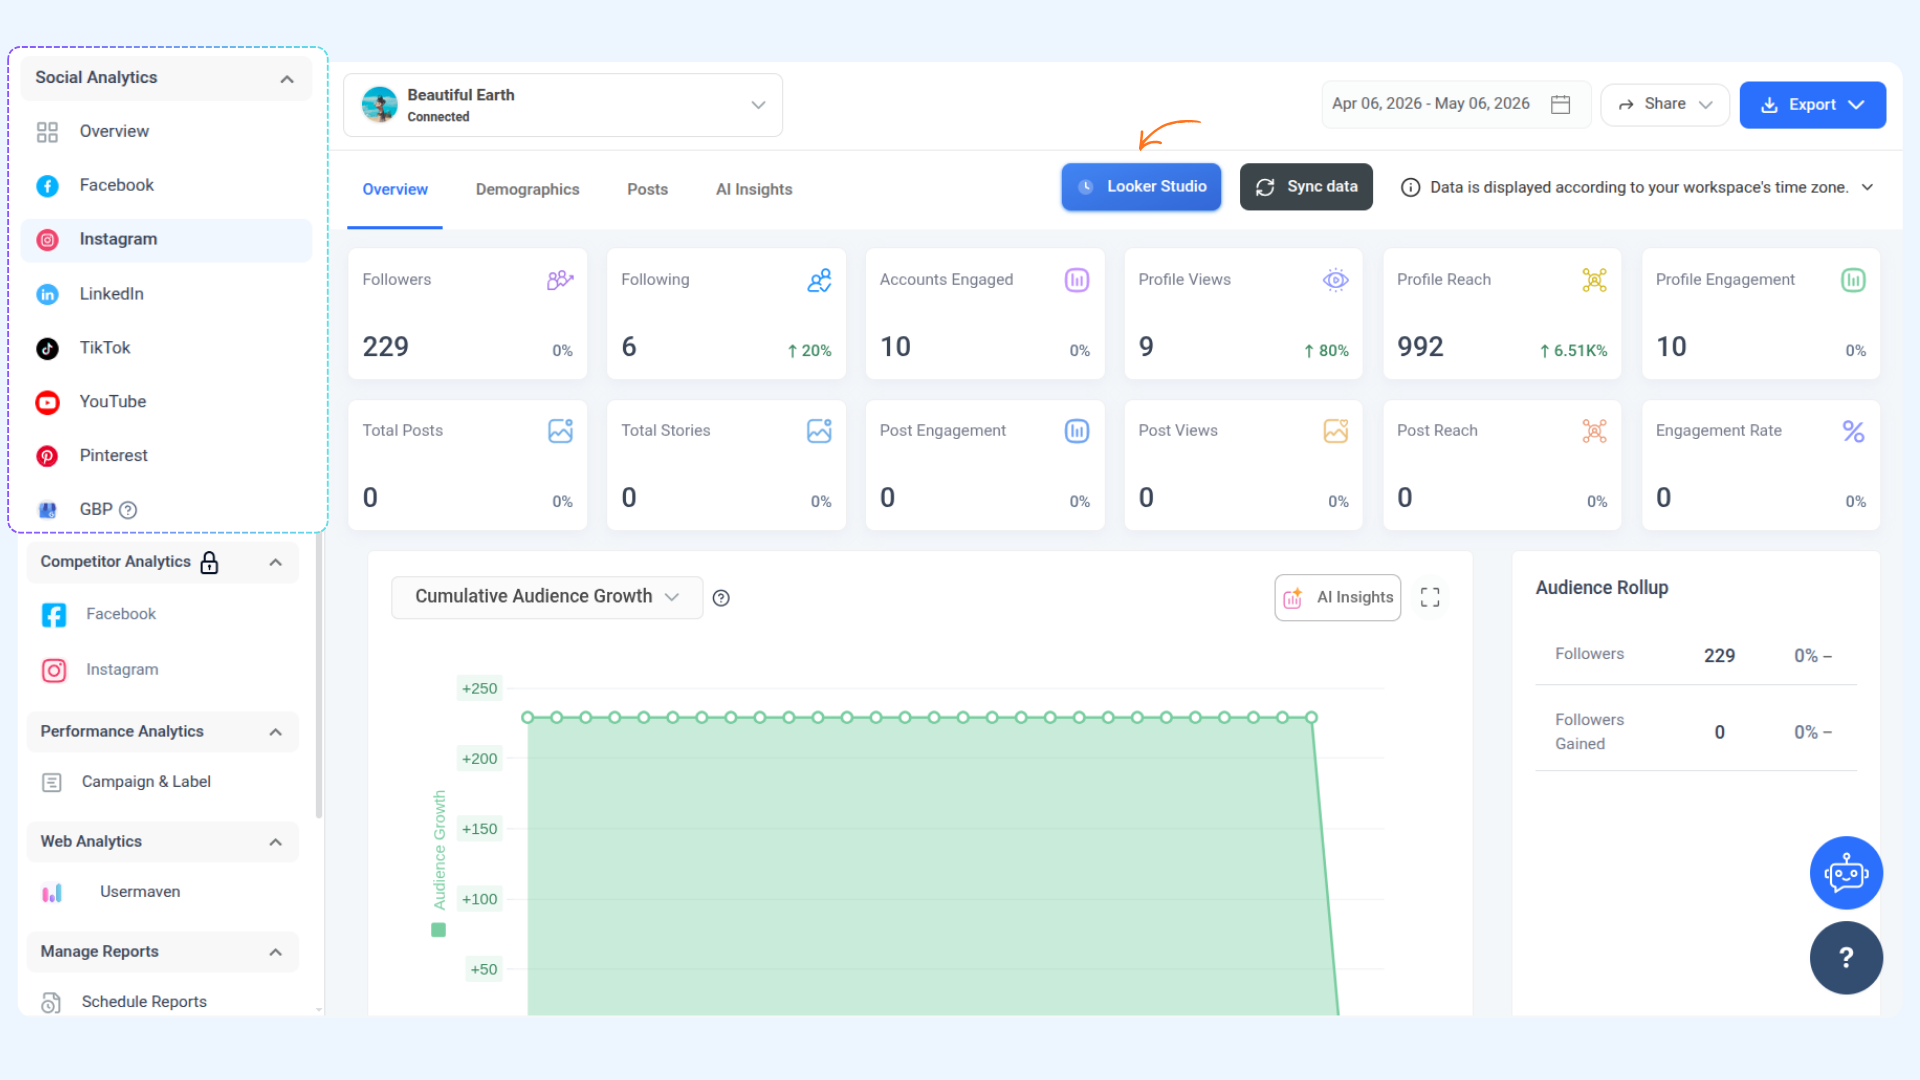
A dialog will open. Your Workspace, Platform, and Account are already filled in based on the page you are currently viewing — no need to select them manually.
Choose how you want to proceed:
Facebook Analytics Dashboard (Recommended) — opens the pre-built template with your data already connected
Start Fresh — opens a blank report with your data source connected, giving you full control over the layout
Click Open in Data Studio. From here the connection flow is identical to the main Data Studio page — refer to the steps above for what to expect next.
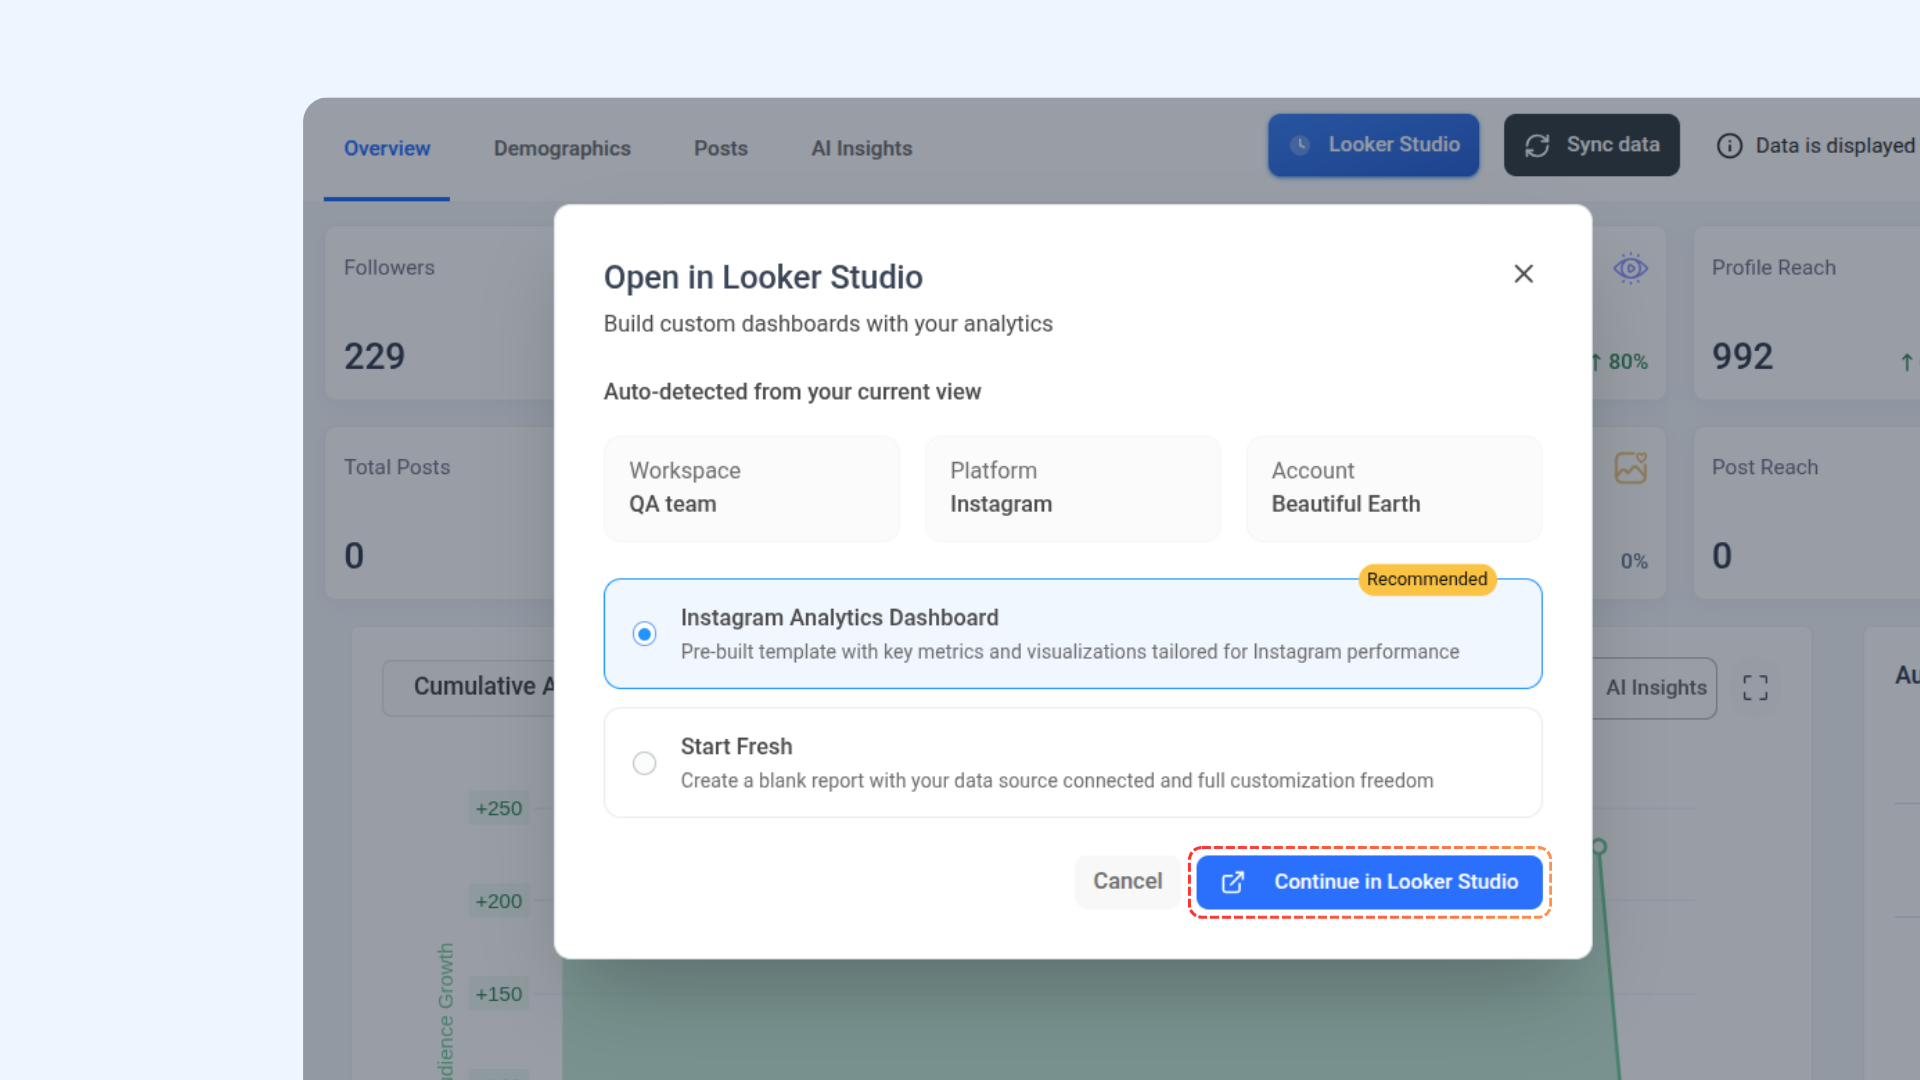
FAQs
How many requests can the connector make? The connector uses Google Apps Script URL Fetch calls — free Gmail accounts are limited to 20,000 calls per day, while Google Workspace accounts get 100,000 per day. These quotas reset every 24 hours.
What is the difference between the template and Start Fresh? The template gives you a ready-made dashboard with the most common KPIs already laid out — just connect your account and it populates automatically. Start Fresh gives you a blank report with your data source already connected, so you can build the layout exactly how you want it.
Why is my report not showing any data? A few things to check — make sure you selected the correct account during setup, and that the account has activity within the date range you are viewing. If the account was recently connected to ContentStudio, historical data may be limited. You can also click Refresh Fields on the data source page in Data Studio to pull the latest data.
Can I report on multiple platforms in one dashboard? Each data source connects to one platform at a time. However you can add multiple data sources to the same Data Studio report and use the Blend Data feature to combine metrics from Facebook, Instagram, and LinkedIn in a single chart.
Can I share my dashboard with clients? Yes. In Data Studio, click Share to send a live link, schedule automatic email delivery, or embed the dashboard on a website or client portal.
I regenerated my API key — why did my reports break? Regenerating your API key in ContentStudio disconnects any existing Data Studio reports that were built using the old key. To fix them, open the affected report in Data Studio, find the data source, click Edit Connection, and reconnect using the new key.
Can I edit the template after opening it? Yes. When you open the template, Data Studio saves a copy to your own Google account — the original is not changed. Click Edit in the top-right corner to modify, rearrange, or rebrand any part of it.
Why am I not seeing all my data in Looker Studio?
The amount of data visible in your report depends on Google Looker Studio and your connected Google account. For very large datasets or extended date ranges, Looker Studio may limit or sample the data shown.
Was this article helpful?