

Instagram Competitor Analytics
Instagram Competitor Analytics helps you monitor and evaluate how other brands and creators in your niche are performing. Add up to five Instagram business profiles to a report and compare their followers, engagement rate, posting activity by post type, most engaged hashtags, bios, and best and worst performing posts side by side — so you can spot trends, discover opportunities and refine your own Instagram strategy, all from the same Analytics dashboard you use for your own accounts.
How to Access Instagram Competitor Analytics
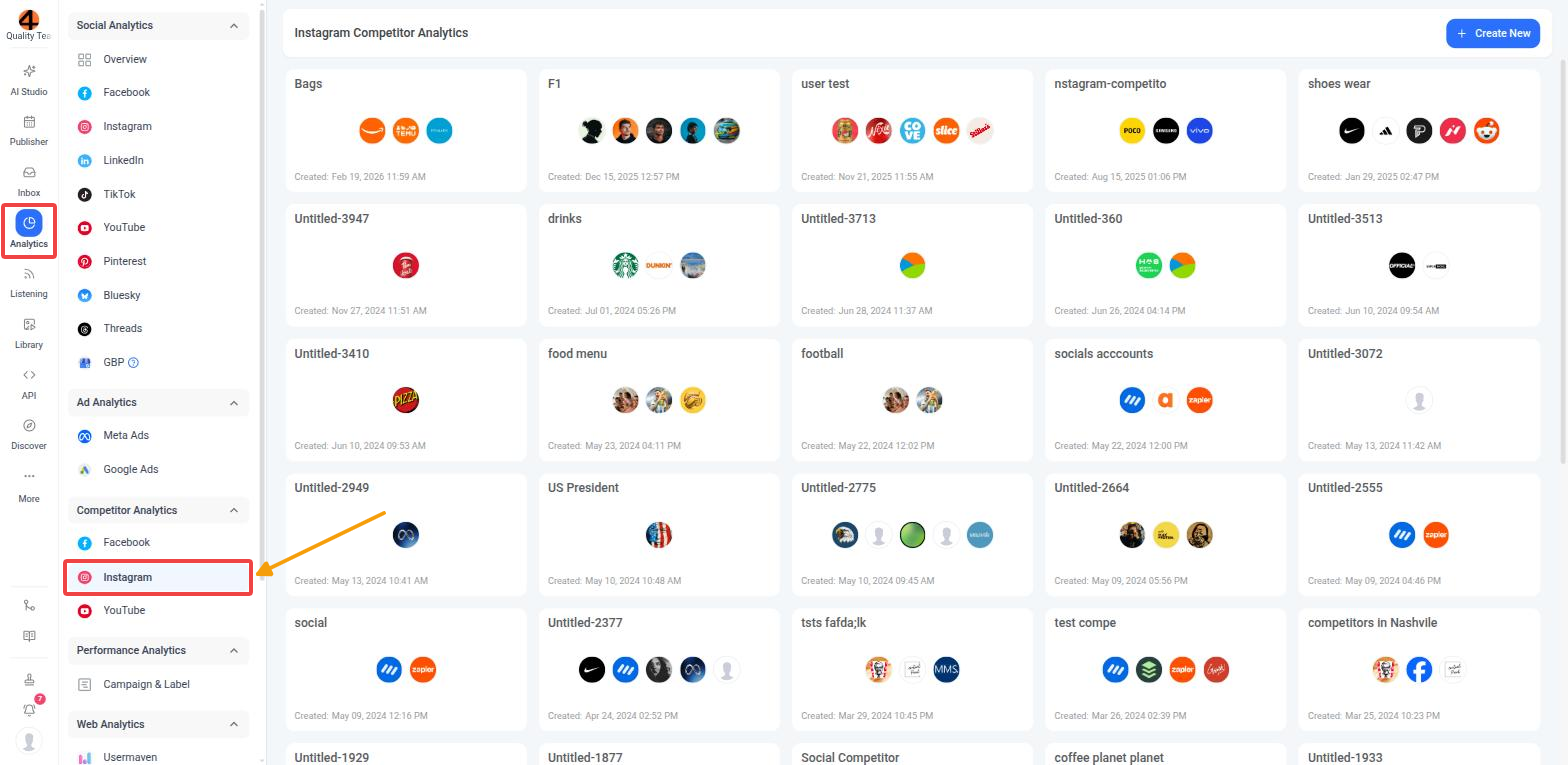
Here's how to open Instagram Competitor Analytics inside ContentStudio.
Creating a Competitor Report
A competitor report (previously called a competitor list) is a saved group of up to five Instagram accounts that you can compare side by side and reopen at any time.
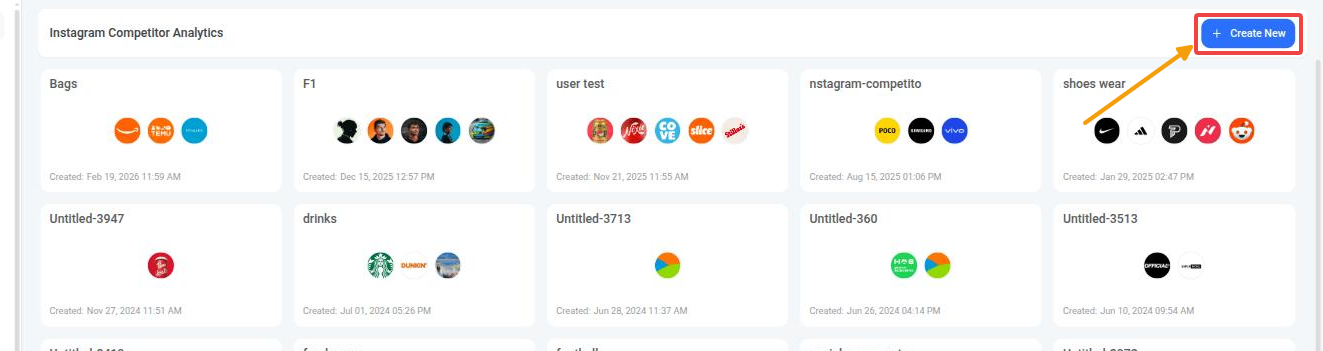
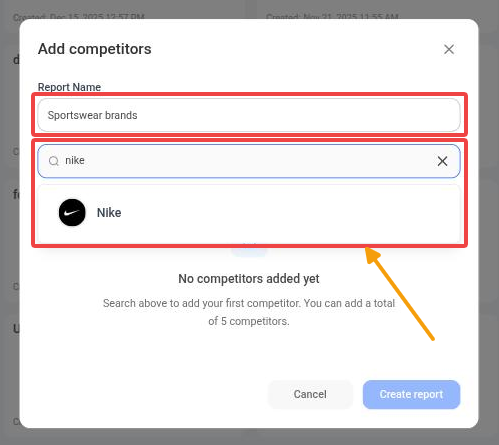
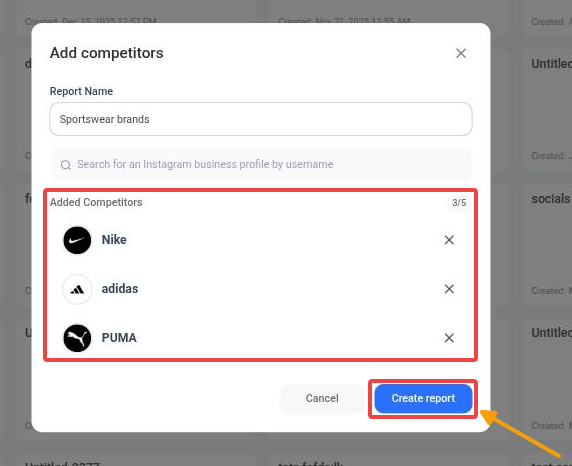
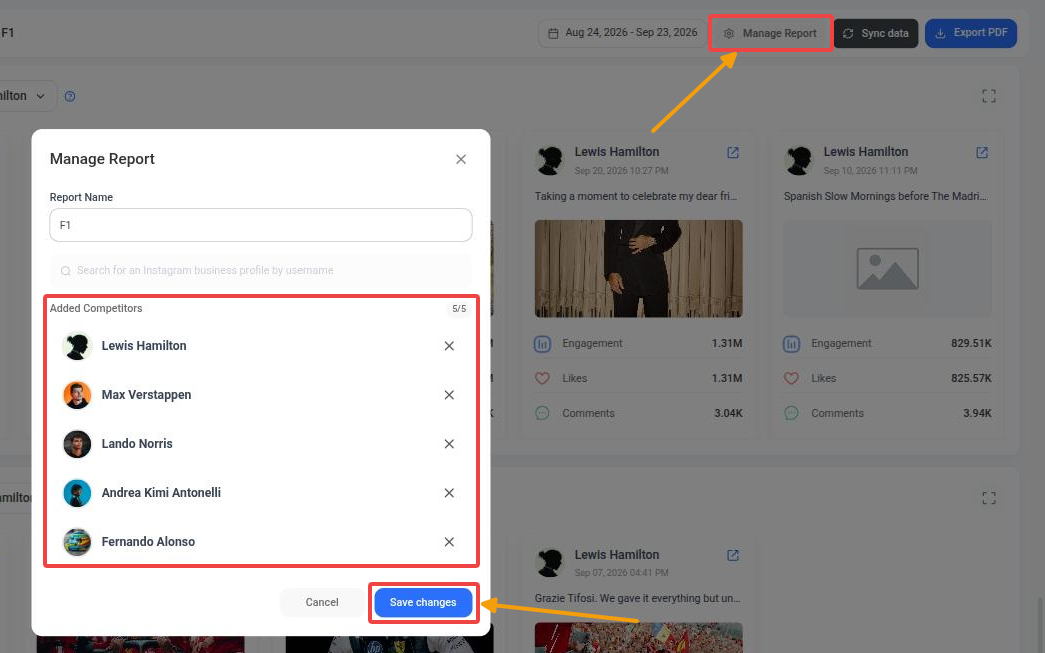
- You can add up to 5 competitors per report. To track more accounts, create additional reports.
- Reports are platform-specific — an Instagram report can only contain Instagram accounts.
- Competitor tracking is completely private. The accounts you track are never notified.
Managing Your Competitor Reports
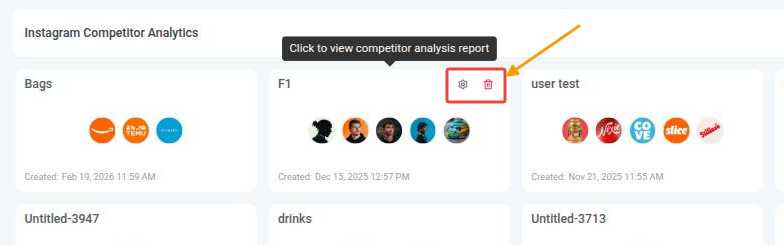
Every saved report appears as a card on the report list, showing the report name, the competitors' profile pictures and the date and time it was created. Click a card to open the report.
You can also edit a report while it's open: click Manage Report in the top-right corner, make your changes, and click Save changes. Updating your competitors from time to time keeps your insights fresh and relevant.
Selecting a Date Range
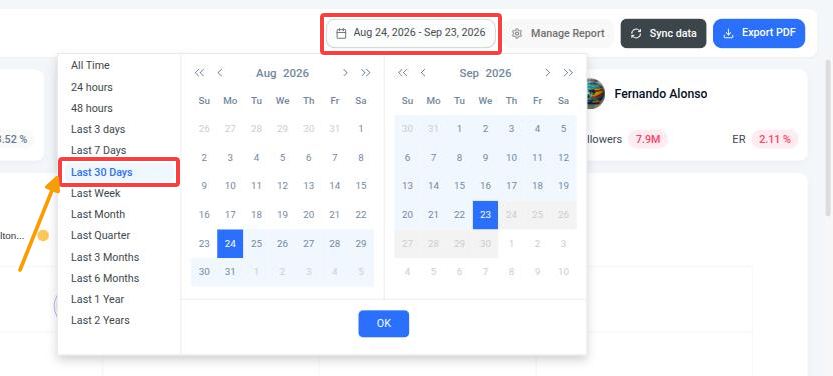
Click the date range selector in the top-right corner of a report to filter the analytics to a specific timeframe. Available presets include:
- All Time
- 24 hours / 48 hours / Last 3 days
- Last 7 Days / Last 30 Days
- Last Week / Last Month / Last Quarter
- Last 3 Months / Last 6 Months
- Last 1 Year / Last 2 Years
You can also pick a custom date range on the calendars and click OK to apply it. Use Sync data next to it to fetch the latest data for the competitors in the report.
Understanding Your Competitor Report
A competitor report is made up of the sections below. Each competitor keeps the same colour in every chart, you can hover over any chart to see exact values, and the expand icon in the top-right corner of a section opens it in full screen. Hover over the question mark icon next to a section title for a short explanation of that section.
Competitor Cards
The top of the report shows a card for each competitor with their profile picture, name, total Followers and ER (engagement rate). The highest value across competitors is highlighted in green and the lowest in red.

Competitors' Performance Comparison
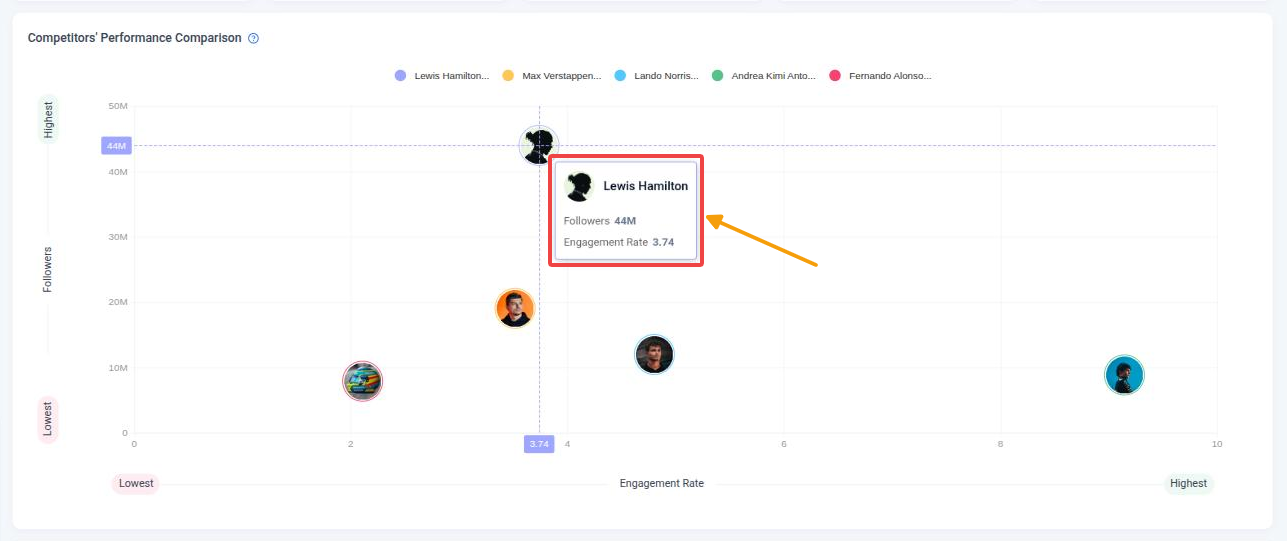
This chart plots every competitor by engagement rate (X-axis, increasing from left to right) and followers (Y-axis, increasing from bottom to top), so you can see at a glance who combines a large audience with strong engagement. Hover over a competitor's picture to see their exact followers and engagement rate.
Competitors' Comparative Table
The comparative table gives you a side-by-side numeric breakdown of every competitor in the report.
The table includes the following columns:
- Followers Trend — a mini graph of each competitor's follower growth over the selected period.
- Followers and Followers % chg. — total followers and how they changed.
- Post/ Week and Post/ Week % chg. — how many posts the competitor publishes per week on average, and how that changed.
- ER by Followers and ER by Followers % chg. — engagement rate calculated against followers, and how it changed.
Values highlighted in green are the highest in their column and values in red the lowest. Green up arrows show a gain and red down arrows a loss. Click a column header to sort the table.
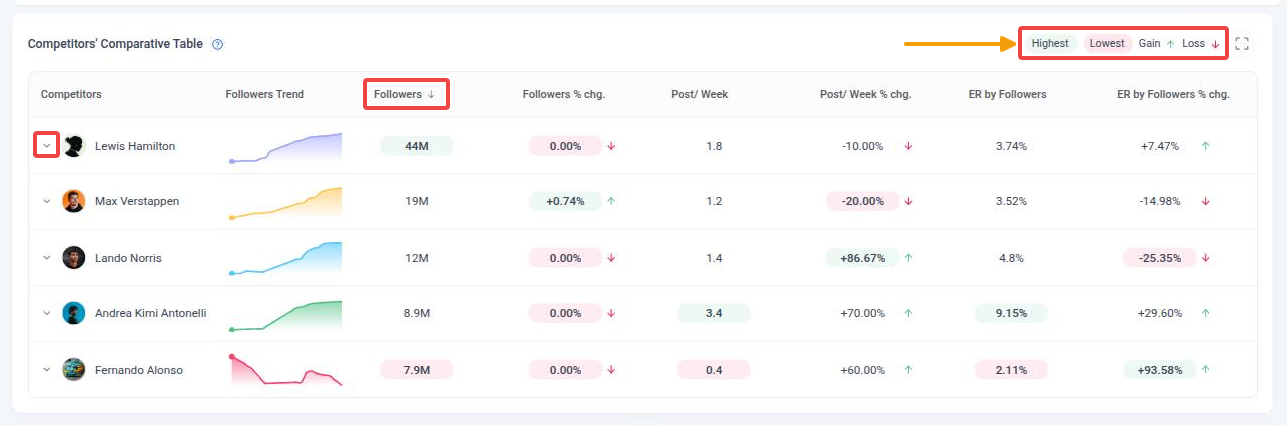
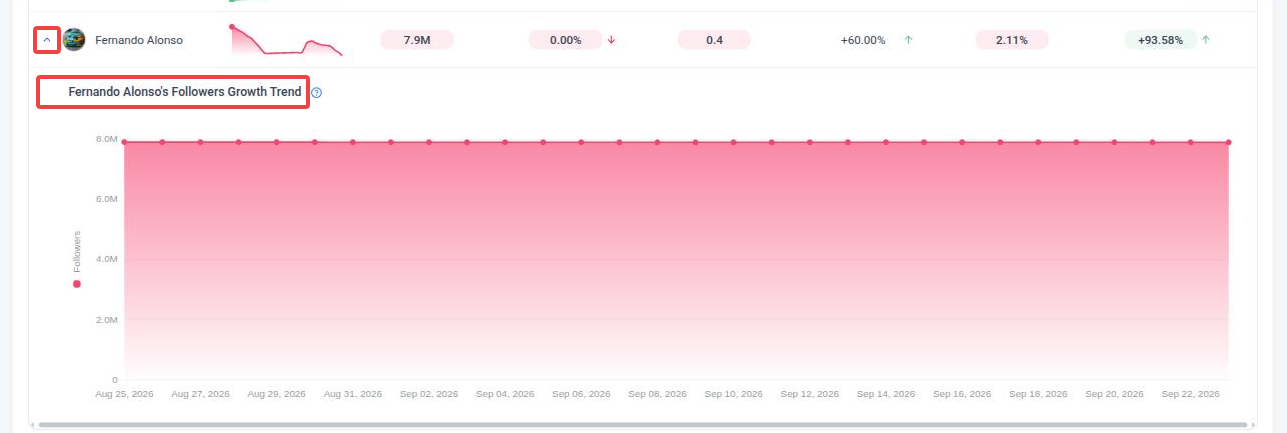
Click the arrow next to a competitor's name to expand their Followers Growth Trend chart, which shows their follower count day by day for the selected period.
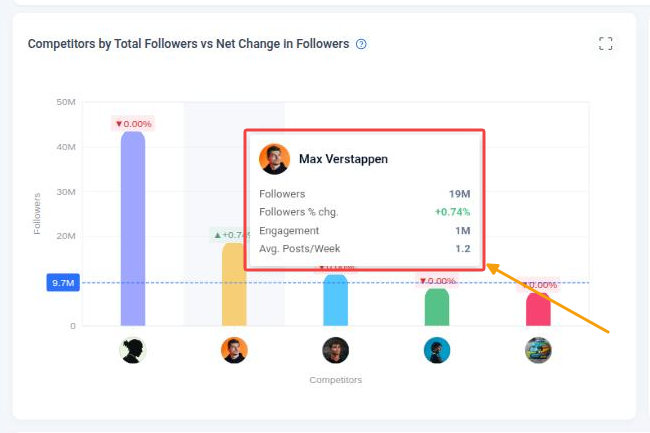
Competitors by Total Followers vs Net Change in Followers
This bar chart compares each competitor's total followers (the height of the bar) with the change in their followers over the selected period (the label above the bar — green for growth, red for decline), so you can see who is actually growing rather than just who is biggest. Hover over a bar to see followers, follower % change, engagement and average posts per week. The change can only be calculated when historical data is available for that competitor.
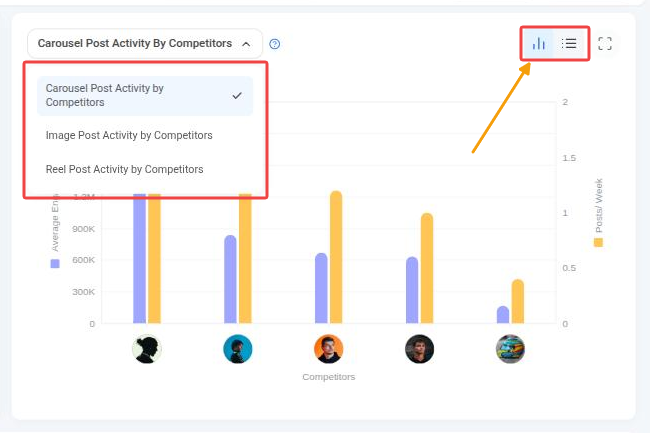
Post Activity by Competitors
Use the dropdown to switch between Carousel, Image and Reel posts. For the selected post type, the chart compares each competitor's average engagement (purple bars) with the number of posts of that type they publish per week (yellow bars), so you can see which format performs best for them. Click the list icon to switch to a table with each competitor's posts, total engagement and ER by followers, and click a column header to sort it in ascending or descending order.
Most Engaged Hashtags
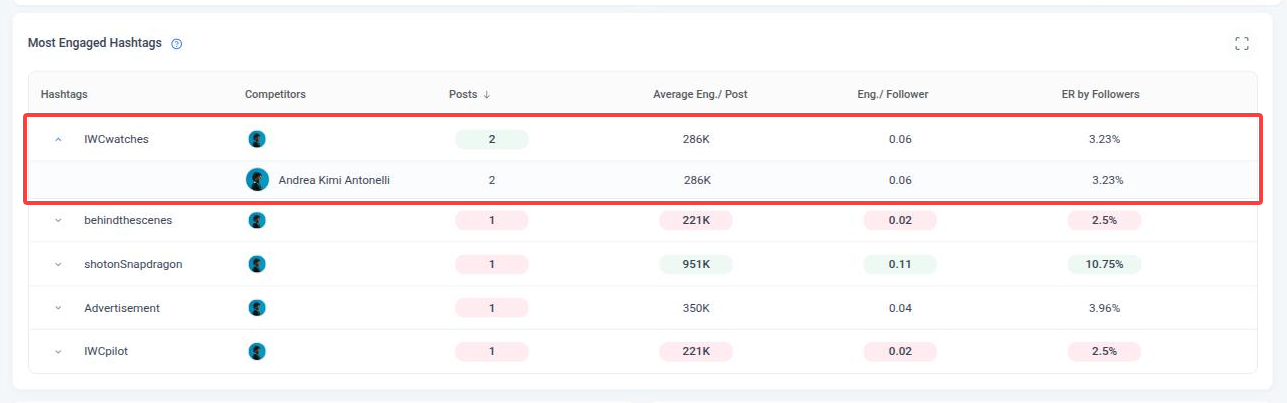
This table lists the hashtags that brought competitors the most engagement during the selected period, with the number of Posts that used each hashtag, Average Eng./ Post, Eng./ Follower and ER by Followers. Click the arrow next to a hashtag to see which competitors used it and how it performed for each of them.
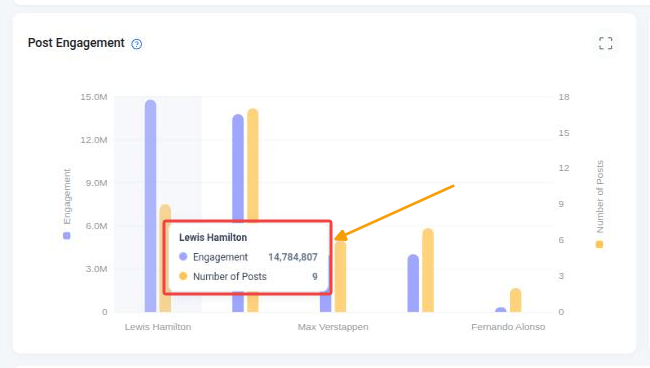
Post Engagement
Post Engagement compares the total engagement each competitor received (purple bars) with the number of posts they published (yellow bars) during the selected period. Hover over a competitor to see the exact figures.
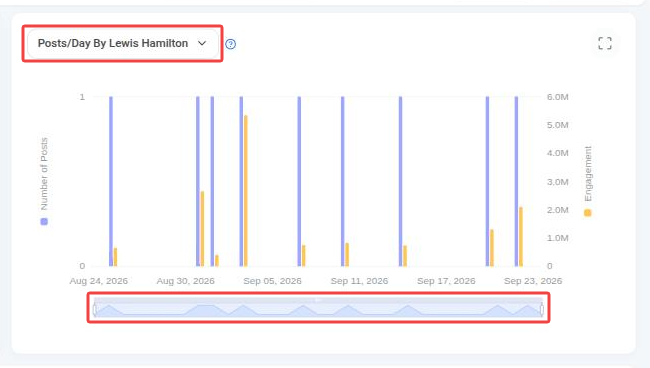
Posts/Day
Choose a competitor from the dropdown to see how many posts they published each day and how much engagement those posts received, so you can benchmark their posting cadence against your own. Drag the handles on the slider under the chart to zoom in on part of the date range.
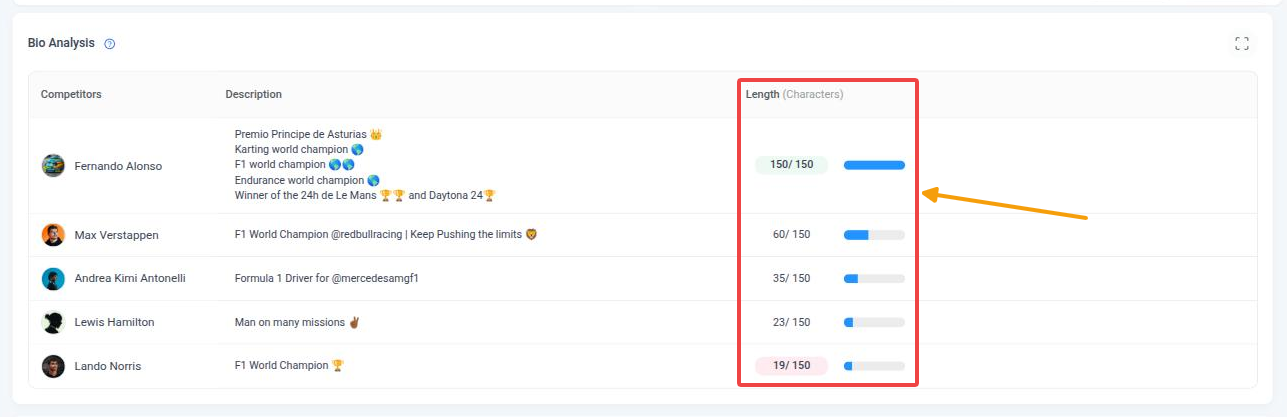
Bio Analysis
Bio Analysis shows each competitor's Instagram bio and how many of the 150 available characters it uses, so you can compare how others in your niche describe themselves and refine your own profile description.
Top and Least Performing Posts
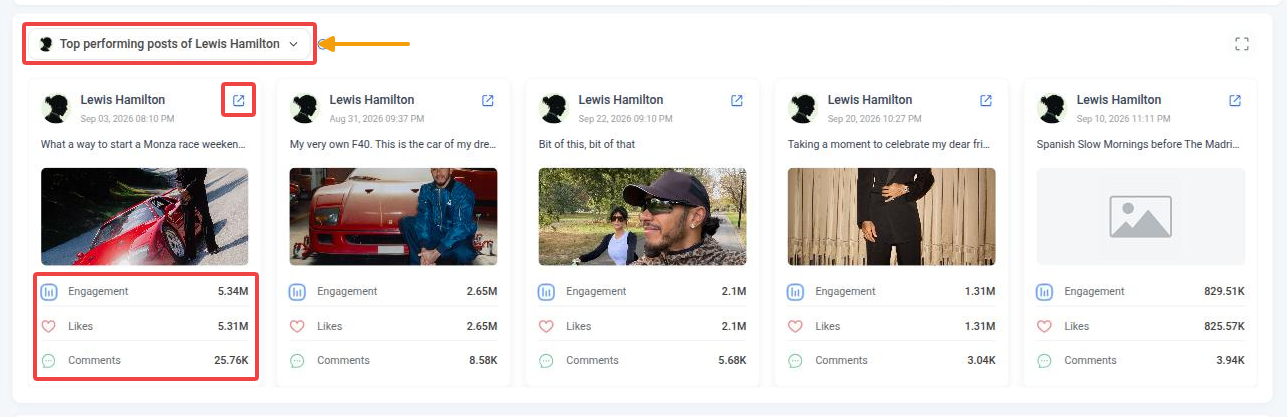
Select a competitor from the dropdown to see the five posts that received the most engagement (Top performing posts) and the five that received the least (Least performing posts) during the selected period. Each post shows its Engagement, Likes and Comments, and the open icon takes you to the post on Instagram.
Exporting a Competitor Report as PDF
You can turn any competitor report into a clean, well-structured PDF to share with your team or clients.
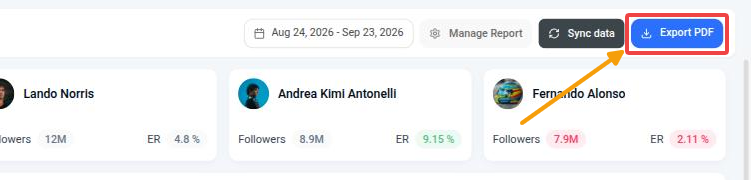
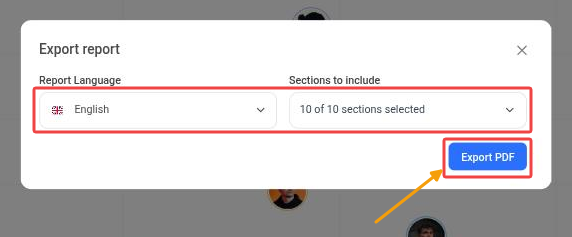
- Always make sure the competitors and date range are set before exporting — the PDF uses what's currently selected in the report.
- Sections you can include: Competitors, Competitors' Performance Comparison, Competitors' Comparative Table, Competitors by Total Followers vs Net Change in Followers, Post Activity by Competitors, Most Engaged Hashtags, Post Engagement, Posts/Day, Bio Analysis, and Top and least performing posts.
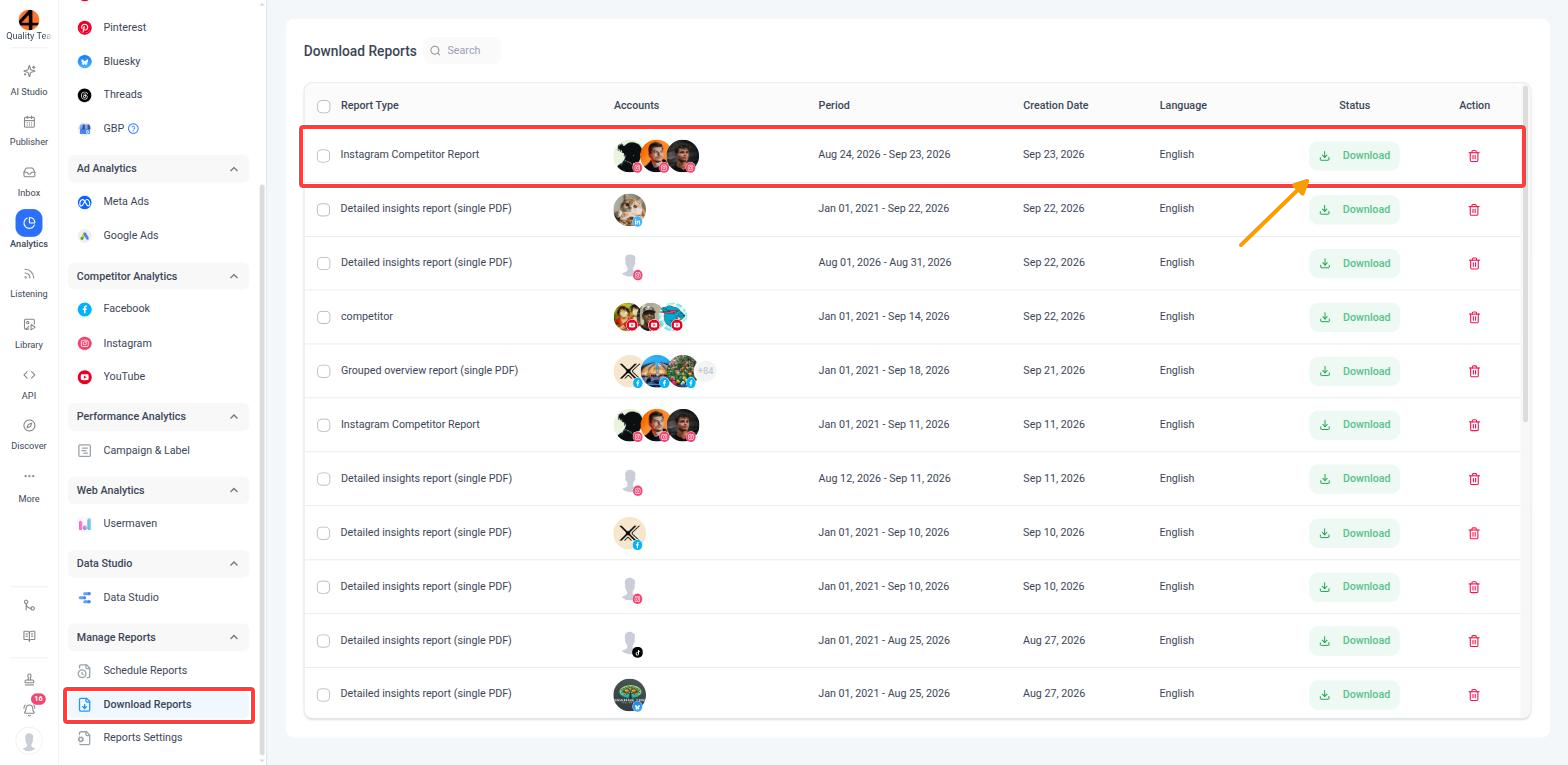
- If your export isn't listed straight away, wait a moment and refresh the Download Reports page. Earlier exports stay there, so you can download them again at any time.
FAQs
How many competitors can I add to a single report?
You can add up to 5 competitors per report. If you want to track more accounts, create additional reports for better organisation.
Which Instagram accounts can I add?
Instagram business profiles. Search for them by username in the Add competitors window.
Can I edit or delete a competitor report later?
Yes. Hover over the report on the list and click the gear icon to edit it or the trash icon to delete it. You can also click Manage Report inside an open report.
What date ranges can I apply?
Any preset from 24 hours to Last 2 Years or All Time, or a custom date range picked on the calendar. This lets you analyse performance within a specific timeframe.
Can I add Instagram and Facebook competitors to the same report?
No. Each report is platform-specific, so create a separate report for Instagram, Facebook and YouTube.
Can competitors see that I am tracking them?
No. Competitor tracking is completely private and competitors are not notified.
Why does a section say "There is nothing to show for the dates you selected"?
The competitors have no matching posts or data in that period. Try selecting a wider date range.
Can I customise the layout or content of the PDF report?
You can choose the report language and which sections to include. The layout itself is fixed to keep reports consistent, with clear pagination and platform branding such as competitor avatars and the selected date range.
Where can I find previously exported reports?
All exported reports are available under Analytics → Manage Reports → Download Reports, where you can track their progress and download past reports again.
What happens if the PDF export fails?
You'll see an error message with an option to retry. Make sure your internet connection is stable and that the report has data for the selected date range.
Was this article helpful?